
|
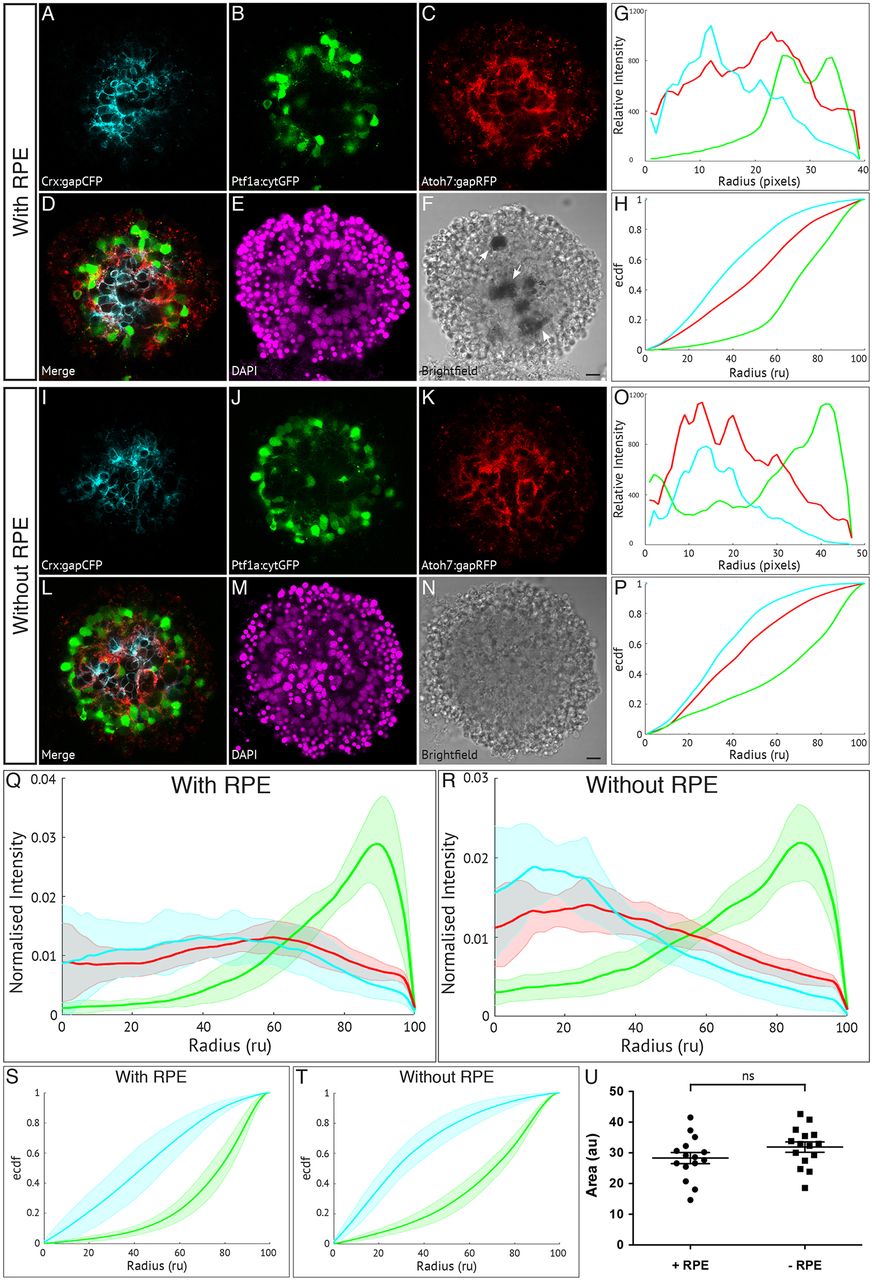
Fig. 3
Retinal pigment epithelium is not required for zebrafish retinal self-organisation. Fluorescence profiles are generated for SoFa1 aggregates cultured either with or without RPE cells. (A-F) Central sagittal section of a SoFa1 aggregate with RPE. (A) Crx:gapCFP-expressing cells are found in the centre of the aggregate. (B) Ptf1a:cytGFP-expressing cells are found in a ring around the edge of the Crx:gapCFP population. (C) Atoh7:gapRFP-expressing cells are found throughout the aggregate. (D) Merge of channels represented in (A-C). (E) DAPI. (F) Bright-field image. Pigment-expressing RPE cells can be seen near the centre of the aggregate (arrows). Scale bar: 10 μm. (G) Fluorescence profiles for the aggregate represented in A-F. (H) ECDF plot for the aggregate represented in A-F. (I-N) Central sagittal section of a SoFa1 aggregate without RPE. (I) Crx:gapCFP-expressing cells are found in the centre of the aggregate. (J) Ptf1a:cytGFP-expressing cells are found in a ring around the edge of the Crx:gapCFP population. (K) Atoh7:gapRFP-expressing cells are found throughout the aggregate. (L) Merge of channels represented in I-K. (M) DAPI. (N) Bright-field image. No pigment-expressing RPE cells can be seen. Scale bar: 10 μm. (O) Fluorescence profiles for the aggregate represented in I-N. (P) ECDF plot for the aggregate represented in I-N. (Q) Average fluorescence profiles with shaded error for aggregates with RPE (n=15, three experimental repeats). (R) Average fluorescence profiles with shaded error for aggregates without RPE (n=15, three experimental repeats). (S) Average ECDF plots for aggregates with RPE. (T) Average ECDF plots for aggregates without RPE. (U) Area (in arbitrary units) is calculated between the ECDF for the Crx:gapCFP population and the ECDF for the Ptf1a:cytGFP population of cells, and compared between aggregates with RPE (+RPE) and without RPE (–RPE) (n=15 for each condition, Mann–Whitney two-tailed t-test, P>0.05).