
|
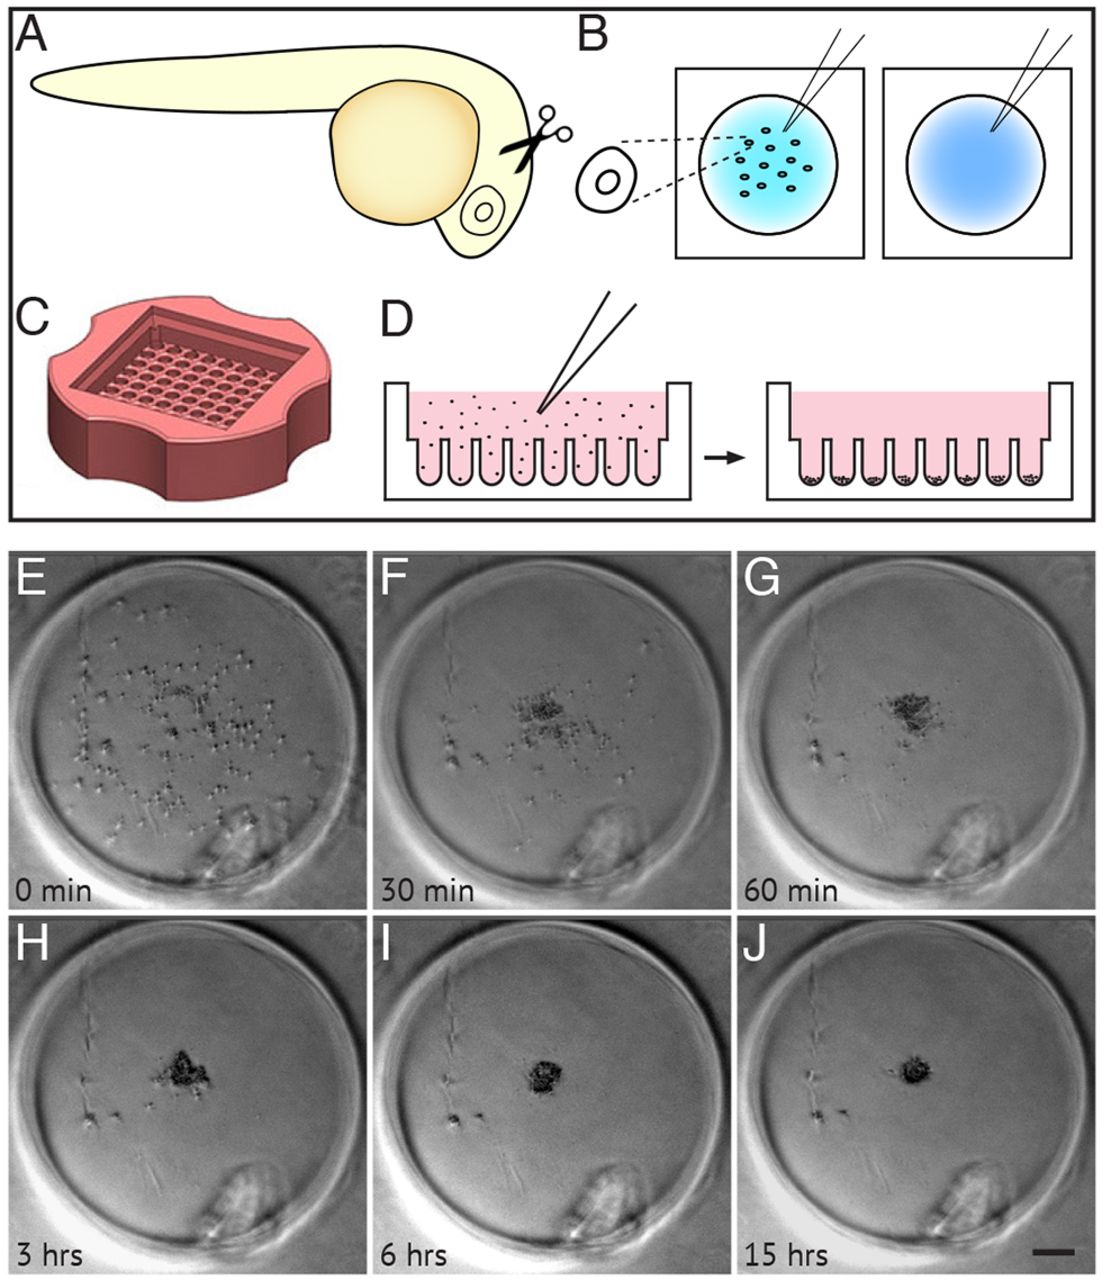
Fig. 1
Dissociation, culture and re-aggregation of zebrafish retinal cells. (A,B) Schematic representing retinas dissected from 24 hpf zebrafish (A), collected into glass dishes and dissociated into single cells (B). (C) Agarose microwell dish cast from the 3D Petri Dish PDMS Mould (adapted, with permission, from http://www.microtissues.com). (D) Schematic representing the seeding chamber of the 3D Petri dish. After seeding, cells settle into individual wells. (E-J) Time-lapse images of a single well from the 3D Petri dish showing 24 hpf cells re-aggregating. (H) Cells are almost fully reaggregated 3 h after seeding. (J) Cells have undergone compaction 15 h after seeding. Time is in minutes and hours after seeding. Scale bar: 100 μm.