
Image
|
Figure Caption
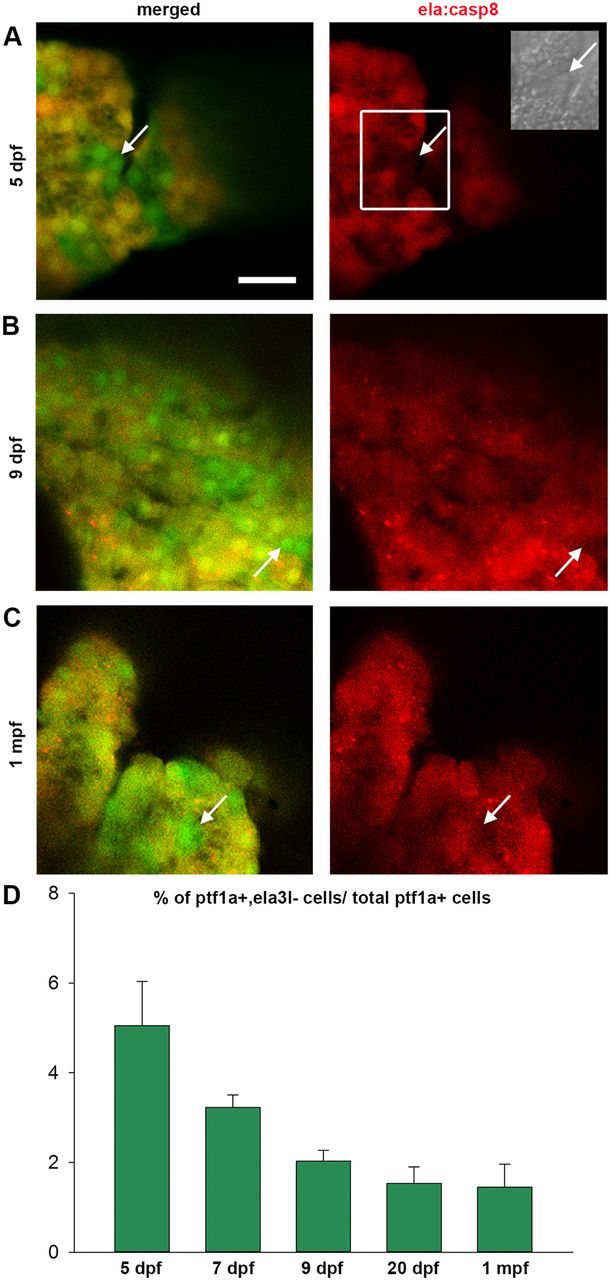
Fig. 5
Ptf1a+, ela3l− cells are present at different developmental stages. (A-C) Confocal images of the anterior pancreatic region of Tg(ela:casp8; ptf1a:eGFP) in 5 dpf (A), 9 dpf (B) and 30 dpf (C) animals (arrows indicate selected GFP+, e2Crimson− cells). (D) Relative amount of ptf1a+, ela3l− cells at different developmental stages (n>5). Mean+s.e.m. Scale bar: 20 µm.
Acknowledgments
This image is the copyrighted work of the attributed author or publisher, and
ZFIN has permission only to display this image to its users.
Additional permissions should be obtained from the applicable author or publisher of the image.
Full text @ Dis. Model. Mech.