
|
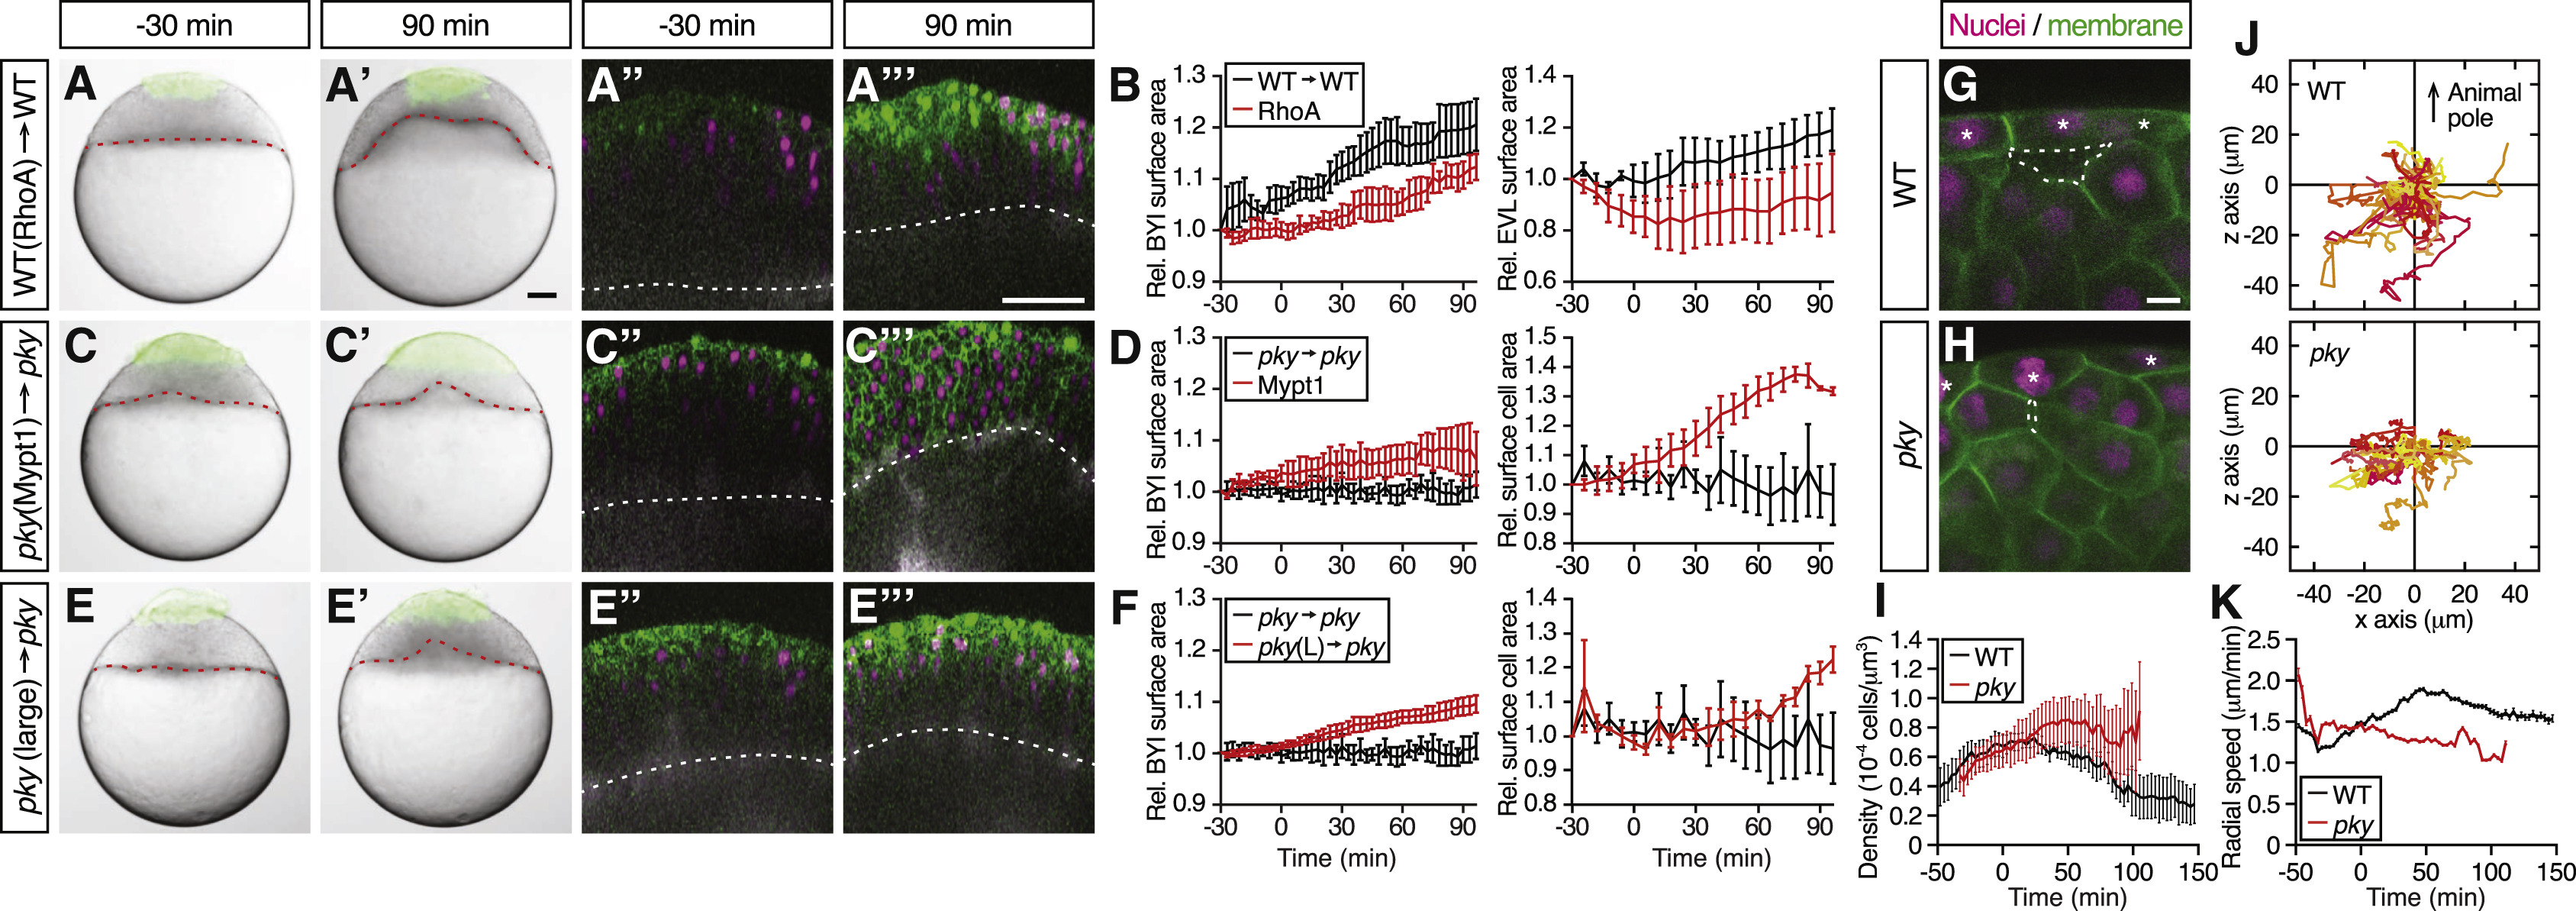
Fig. 7
Surface Cell Expansion Reduces Deep Cell Density and Increases Deep Cell Motility
(A–F) Transplantation of EVL/surface cells from RhoA-overexpressing WT to WT embryos (A) and (B) (n = 3 embryos), Mypt1-overexpressing pky to pky embryos (C) and (D) (n = 3 embryos), and of large patches of pky surface cells replacing a smaller patch of surface cells in pky embryos (E) and (F) (n = 3 embryos). Bright-field images of mosaic embryos before (−30 min) and after completion of doming (+90 min) with transplanted cells marked by fluorescent dextran; green (A), (A′), (C), (C′), (E), and (E′). Confocal images with plasma membrane expressing mem-GFP (green), nuclei marked by H2A-mCherry (magenta) and BYI outlined by fluorescent dextran (white); (A″), (A‴), (C″), (C‴), (E″), and (E‴). Transplanted cells were marked by fluorescent dextran; green (A), (A′), (C), (C′), (E), and (E′), or H2B-GFP; green (A″), (A‴), (C″), (C‴), (E″), and (E‴). Red and white dashed lines, BYI. Changes in relative BYI area (left column) and relative EVL/surface cell area (right column) as a function of time during doming in the different transplantation experiments (B), (D), and (F). The control data in (B), (D), and (F) were taken from Figures 5F and 5H. Error bars, ±SEM. Scale bars, 100 μm.
(G–I) Exemplary confocal images of deep cell clustering below EVL/surface cells at the onset of doming in WT (G) and pky embryos (H). Space between deep cells is marked by a dashed line. Asterisks, EVL/surface cells. Plasma membrane was labeled by mem-GFP (green) and nuclei by H2A-mCherry (magenta). Density of deep cell nuclei in WT and pky mutant embryos was quantified within an area of ∼50 μm below EVL/surface cells as a function of time during doming (I). Scale bars, 10 μm. Error bars, ± SEM, n = 6 embryos for WT and pky each.
(J and K) Exemplary trajectories of deep cell movements beneath EVL/surface cells. Nuclei of deep cells within and area of ∼60 μm below EVL/surface cells were tracked in WT (top, n = 57 cells) and pky embryos (bottom, n = 35 cells) for 100 min from the onset of doming and plotted from the origin (J). The z axis corresponds to the animal-vegetal axis of the embryo with animal pole up. Radial speed of deep cells in WT and pky mutant embryos within an area of ∼50 μm below EVL/surface cells (K). Error bars, ±SEM, n = 6 embryos for WT and pky each.
See also Movie S5.
Reprinted from Developmental Cell, 40(4), Morita, H., Grigolon, S., Bock, M., Krens, S.F., Salbreux, G., Heisenberg, C.P., The Physical Basis of Coordinated Tissue Spreading in Zebrafish Gastrulation, 354-366.e4, Copyright (2017) with permission from Elsevier. Full text @ Dev. Cell