
|
Fig. 3
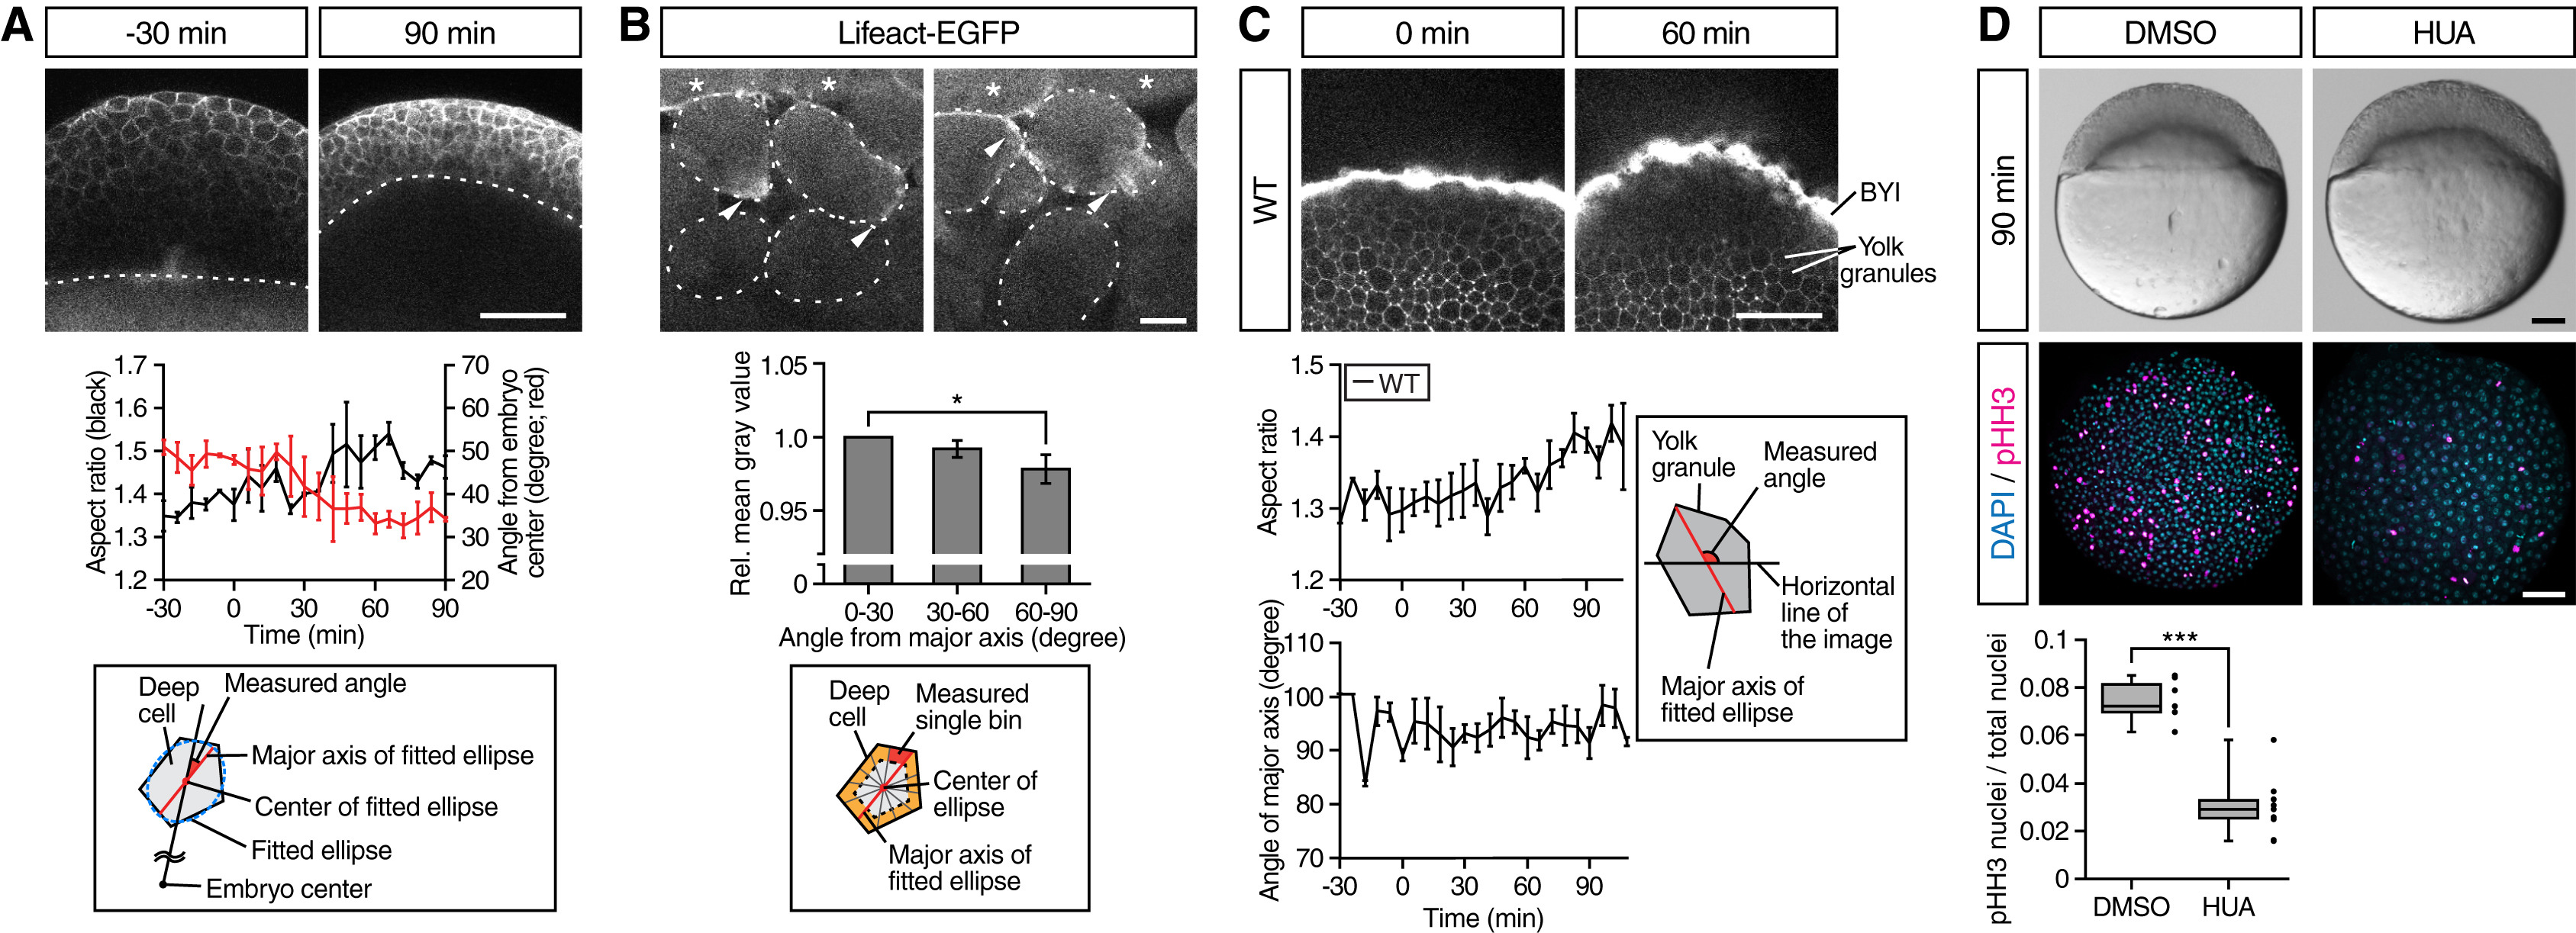
Deep Cells and Yolk Granules Change Their Shape during Doming
(A) Deep cell shape changes in WT embryos. Upper panels are single plane confocal images of deep cells close to the EVL before (−30 min) and after completion of doming (+90 min). Deep cell plasma membrane was labeled by mem-RFP. Dotted lines, BYI position. Middle panel shows quantification of deep cell aspect ratio (black line, left vertical axis) and angle from embryo center (red line, right vertical axis) of deep cells in embryos from −30 to +90 min of doming. Bottom panel shows schematic of deep cell angle measurements. n = 3 embryos. Error bars, ±SEM. Scale bar, 100 μm.
(B) Subcellular localization of actin in deep cells during doming. Upper panels are single plane confocal images of deep cells close to the EVL in Tg(actb1:lifeact-EGFP) embryos during doming. Dotted lines, plasma membrane of individual cells. Asterisks, EVL cells. Arrowheads, polarized actin localization in deep cells. Middle panel shows quantification of actin distribution in polarized deep cells (aspect ratio ≥1.6) during 90 min of doming. Bottom panel shows schematic of the actin distribution analysis in deep cells within an area ≈3 μm away from the plasma membrane (orange) and subdivided in 30° bins relative to the major axis of the fitted ellipse (red). n = 3 embryos. Error bars, ±SEM; ∗p < 0.05; t test. Scale bar, 10 μm.
(C) Yolk granule shape in intact WT embryos. Upper panels are single plane confocal images of yolk granules in embryos injected with fluorescent dextran into the yolk at 0 min (left) and +60 min (right) of doming. Lower left panels are quantification of yolk granule aspect ratio (top) and angle of major axis (bottom) from −30 to +108 min of doming. Lower right panel shows schematic of measured angle in yolk granules. n = 4 embryos. Error bars, ±SEM. Scale bar, 100 μm.
(D) Doming in WT embryos and embryos treated with hydroxyurea and aphidicolin (HUA) to block cell divisions. Upper panels are bright-field images of control (left) and HUA-treated embryos (right) after completion of doming (+90 min). Lower panels are confocal images of control (left) and HUA-treated embryos (right) immunostained for the mitotic marker phosphorylated histone H3 (pHH3; magenta) at the onset of doming (0 min) from animal pole view. All nuclei were labeled by DAPI (cyan). Lower left plot shows ratio of pHH3-positive nuclei to total nuclei number. Boxplots represent 25%, median, 75%, and 95%. ∗∗∗p < 0.001; t test. n = 7 embryos (DMSO) and 10 embryos (HUA). Scale bar, 100 μm.
See also Figure S2 and Movie S3.
Reprinted from Developmental Cell, 40(4), Morita, H., Grigolon, S., Bock, M., Krens, S.F., Salbreux, G., Heisenberg, C.P., The Physical Basis of Coordinated Tissue Spreading in Zebrafish Gastrulation, 354-366.e4, Copyright (2017) with permission from Elsevier. Full text @ Dev. Cell