
|
Fig. S5
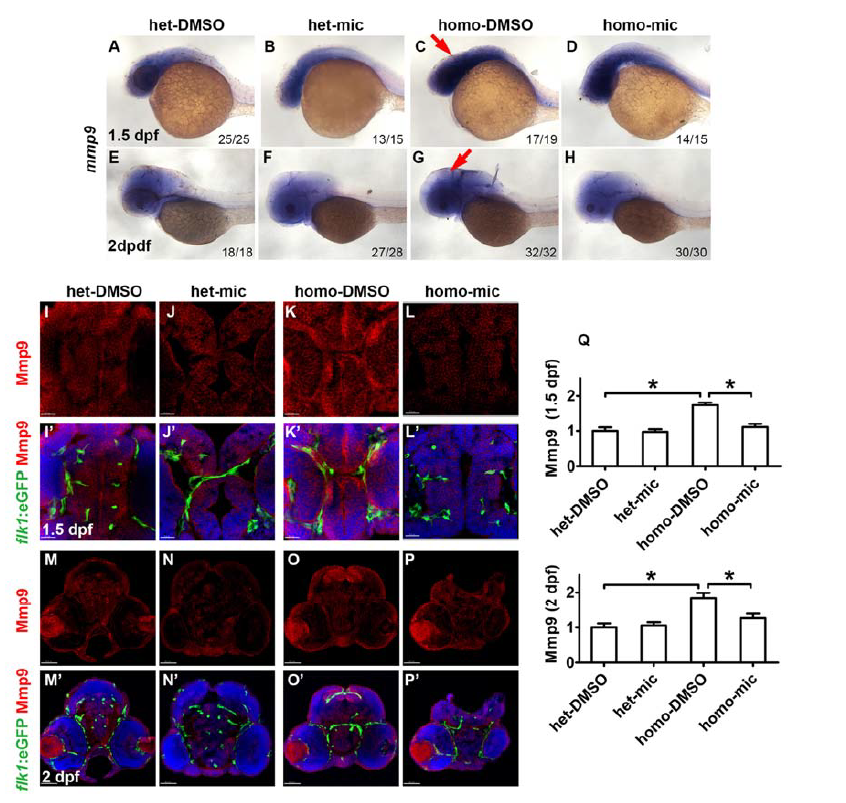
Miconazole inhibits Mmp9 elevation in the brain of fn40a mutants. (A-H) RNA in situ hybridization revealed an increase of mmp9 expression in the brain region of fn40a mutants at 1.5 dpf (C) and 2 dpf (G) compared with heterozygote controls (A, E), and decreased mmp9 expression in fn40a mutants after mic treatment (D, H). A-D, 1.5 dpf; E-H, 2 dpf. A-H, lateral view. Red arrows point to the brain. (I-P, I'-P') Fluorescence immunohistochemistry showed a higher level of Mmp9 (red) in the brain of homozygous fn40a mutants (K, K'; O, O') compared with heterozygous controls in the absence (I, I'; M, M') or presence (J, J'; N, N') of miconazole; and miconazole decreased the Mmp9 level in homozygous mutants (L, L'; P, P'). Tg(flk1:eGFP) (green) was used for labeling brain vessels and DAPI (blue) for staining the nuclei. I-L, I'-L', 1.5 dpf, scale bar is 20 μm; M-P, M'- P', 2 dpf, scale bar is 40 μm. (Q) Intensity of anti-Mmp9 staining signals in the brain regions shown in panels I-P, confirming that the elevated expression of Mmp9 in fn40a mutants was suppressed by miconazole treatments. *p <0.05 by one-way ANOVA with Bonferroni's Multiple Comparison Test. n >10 for each zebrafish independent repeat.