
|
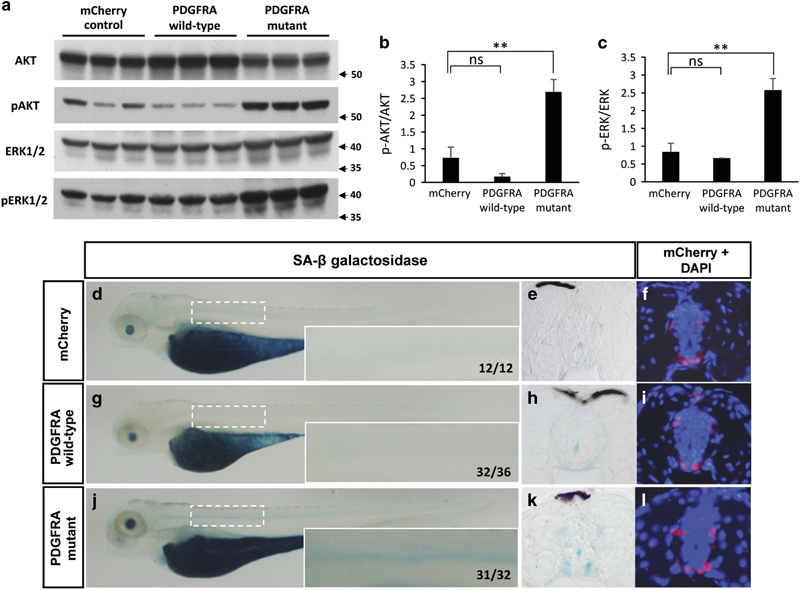
Fig. 4
Overexpression of the PDGFRA wild-type gene activates AKT and ERK at levels optimal for tumorigenicity. (a) Western blot analysis for AKT and ERK1/2 activation in protein lysates prepared from tumors of mCherry control, PDGFRA wild-type, and PDGFRA mutant fish. Similar levels of p-AKT and p-ERK1/2 were detected in PDGFRA wild-type tumors as compared with mCherry control tumors; however, tumors induced by the PDGFRA mutant showed increased levels of p-AKT and p-ERK1/2. Proteins were detected by stripping the membrane and reprobing. Arrows denote protein size (kDa). (b and c) Statistical analysis of mean±s.d. of p-AKT/total AKT and p-ERK/total AKT using ImageJ. Asterisks indicate statistical significance (**P<0.005). (d, g and j) Representative images of SA-β galactosidase-stained transgenic fish embryos of mCherry control (n=12), PDGFRA wild-type (n=36) and PDGFRA mutant (n=32) in the nf1a+/−; nf1b−/−; p53m/m background at 4 d.p.f. The boxed areas were magnified at the right bottom corner of each panel. (e, h and k) Transverse cryosections through the spinal cord of embryos at 4 d.p.f., with mCherry and DAPI (4',6-diamidino-2-phenylindole; f, i and l).