
Image
|
Figure Caption
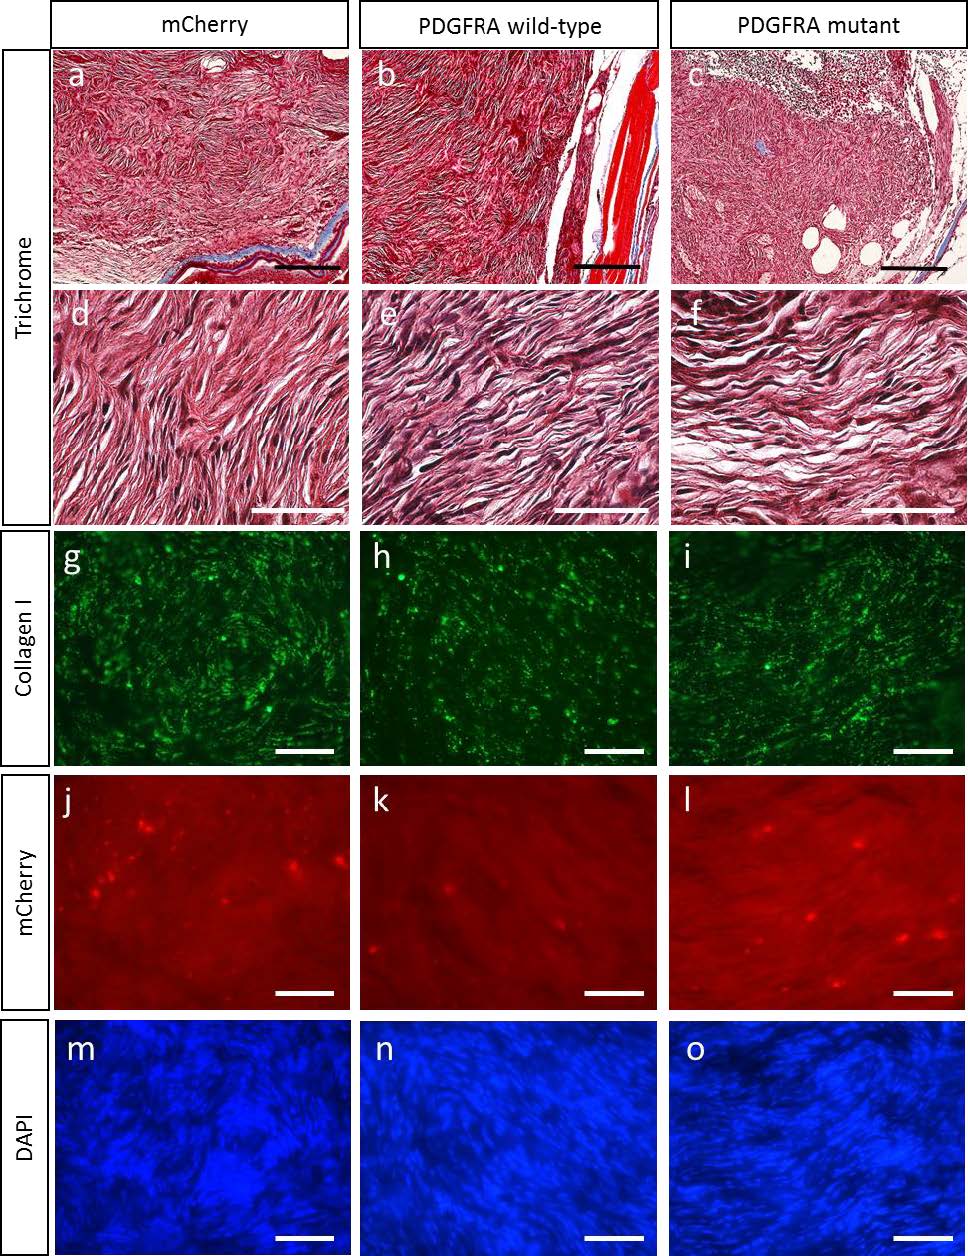
Fig. S5
Fibrosis of the transgenic zebrafish MPNSTs is not changed by either wild-type or mutant PDGFRA (a-c) Representative images of the trichrome stained transgenic fish MPNSTs of (a) mCherry control, (b) PDGFRA wild type, and (c) PDGFRA mutant in the nf1a+/-;nf1b-/- ; p53 m/m background (>30 weeks post fertilization). Panels d, e, and f show the MPNST tumor cells magnified from panels a, b, and c, respectively.(g-i) Representative images of collagen I expression in transgenic fish MPNSTs of mCherry control with (g-i) mCherry and (j-l) DAPI (black scale bar=200 μm, white scale bar=10 μm).
Acknowledgments
This image is the copyrighted work of the attributed author or publisher, and
ZFIN has permission only to display this image to its users.
Additional permissions should be obtained from the applicable author or publisher of the image.
Full text @ Oncogene