
|
Fig. S3
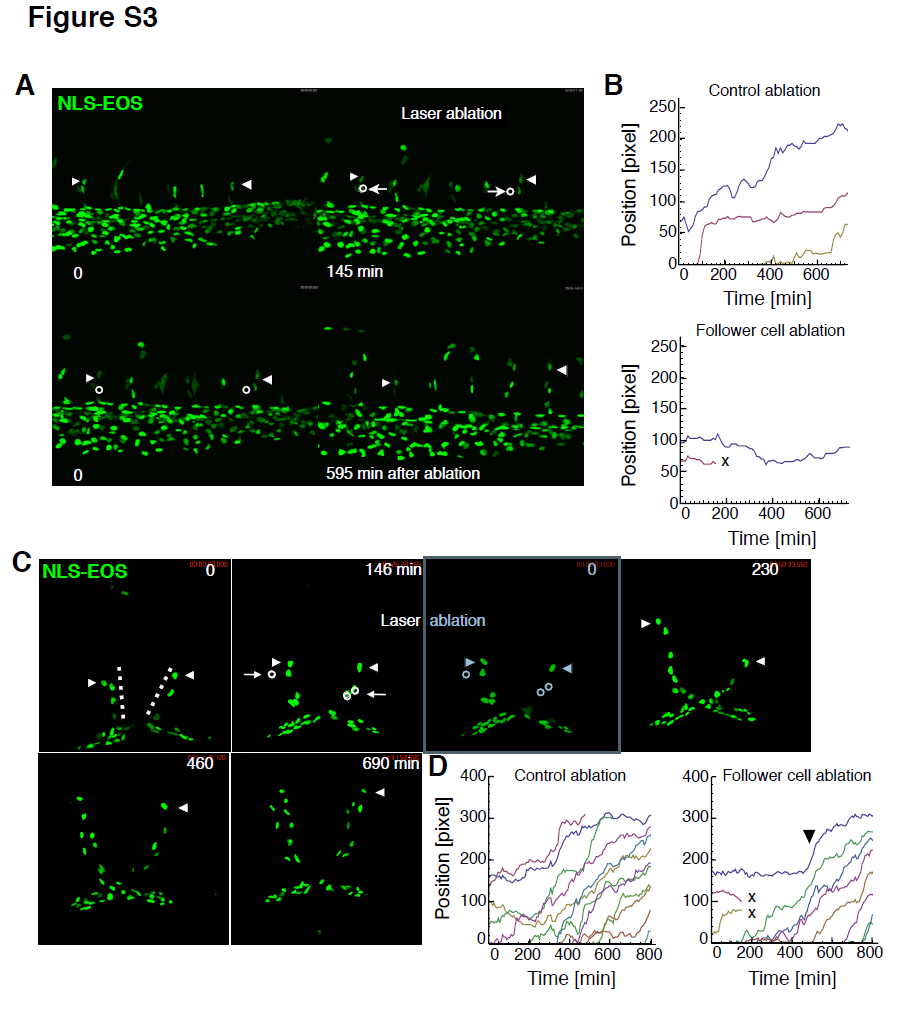
Experimental assessments of regulatory mechanisms of tip EC motility using zebrafish embryos, Related to Figure 7. Representative time-lapse images of angiogenic EC behaviours in the intersegmental vessels (A, at 26 hpf) and the mesencephalic veins (C, dotted line, at 30 hpf) of zebrafish embryos overexpressing NLS-EOS. Follower ECs in the growing vessels (left (A) and right (C) opened circles) (C) and non-vascular tissue near the follower ECs (right (A) and left (C) opened circles) were laser-ablated 2.5 to 3 hours after imaging. Arrowheads and arrows indicate tip ECs and the follower ECs, respectively. See also movies S8 and S10. (B, D) Trajectory analyses corresponding to A and C. In the trajectory analysis, time and positions were adjusted so that at the observation periods would begin at t = 0. “X” shows cell deaths.