
|
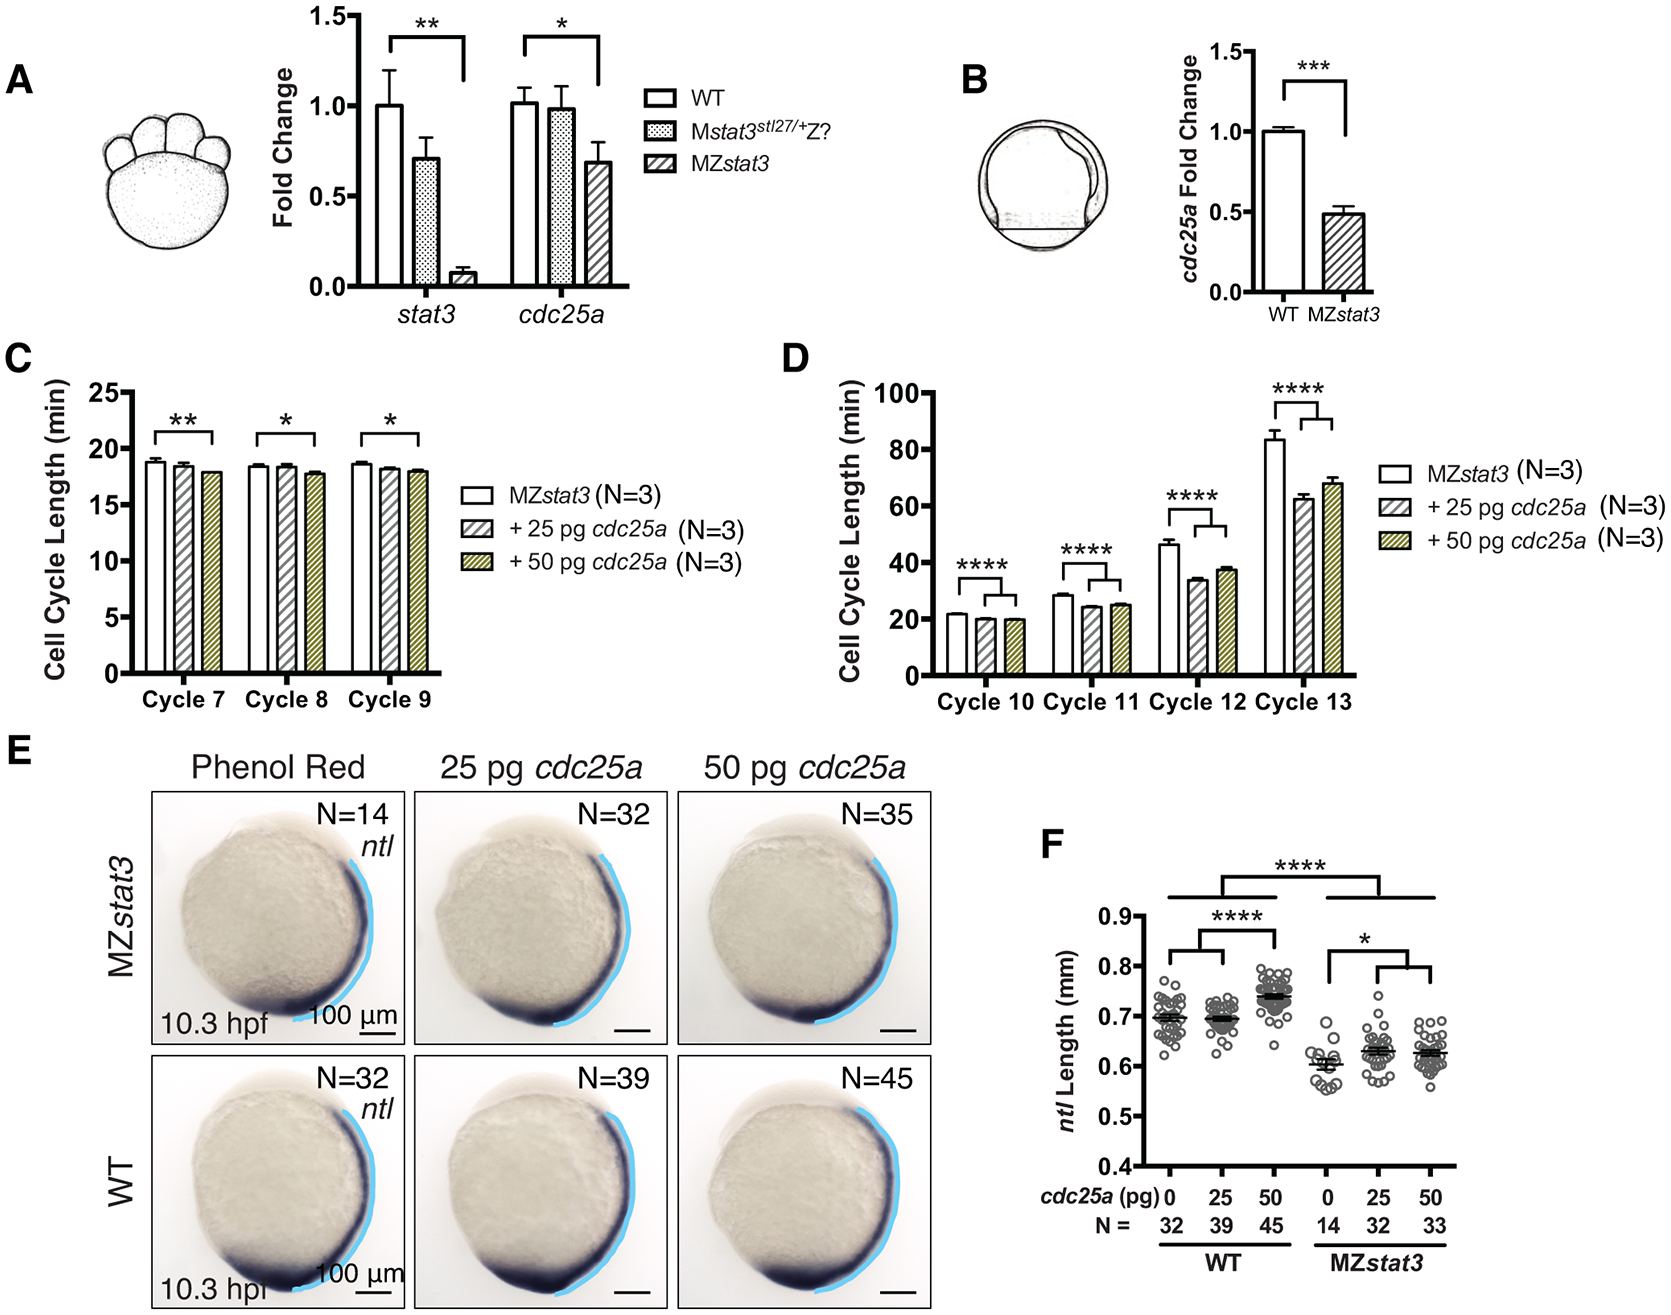
Fig. 9
Stat3 promotes cell cycle progression during zebrafish embryogenesis via upregulation of cdc25a expression.
(A) qRT-PCT analysis of stat3 and cdc25a transcript levels at 1.5 hpf. All results shown were normalized to gapdh. (B) qRT-PCR analysis of cdc25a transcript levels at 8.3 hpf. (C and D) Pre-MBT (C) and post-MBT (D) cell cycle length analyses in 1-somite stage MZstat3 embryos injected with 25 or 50 pg cdc25a RNA. Phenol Red was used as injection control. (E and F) ntl expression in 1-somite stage MZstat3 and WT gastrulae misexpressing Cdc25a (lateral view, anterior to the top). Notochord length (blue line) was quantified in F. *p<0.05, **p<0.01, ***p<0.001, ****p<0.0001, error bars = SEM. See also S9 Fig.