
Fig. S5
- ID
- ZDB-IMAGE-170321-19
- Publication
- Zhang et al., 2017 - Left Habenula Mediates Light-Preference Behavior in Zebrafish via an Asymmetrical Visual Pathway
- All Figures
- Figures for Zhang et al., 2017
|
Fig. S5
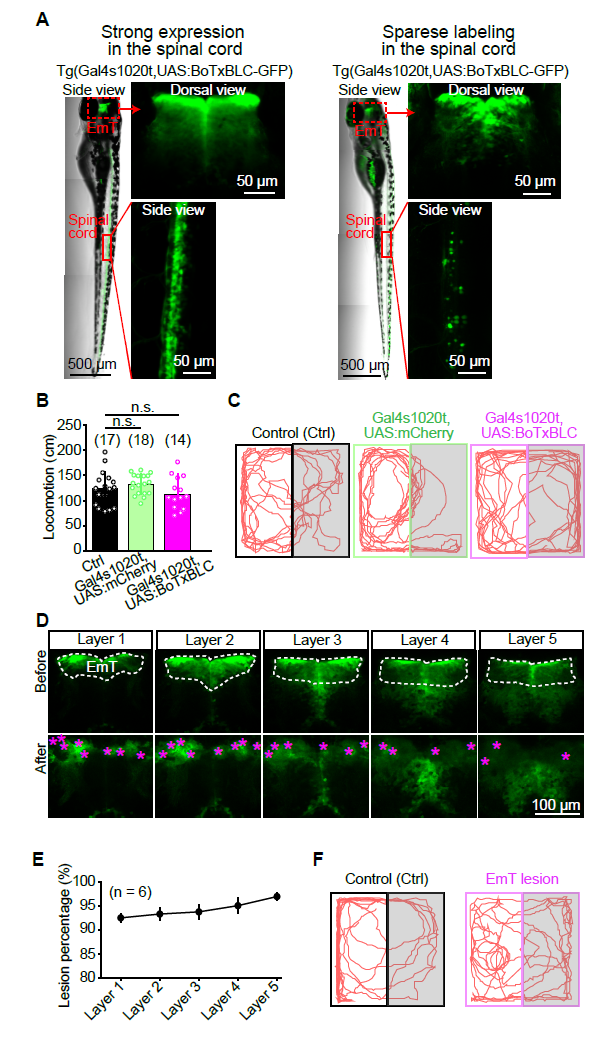
Effect of Ventral Thalamus Silencing and EmT Lesion on Light-Preference Behavior.
(A) Individual difference of BoTxBLC-GFP expression in Tg(Gal4s1020t,UAS:BoTxBLCGFP) larvae. Each whole-body image was spliced from 3 contiguous images due to limited size of the view field of the microscopy. Left, larva showing strong expression in both the EmT and spinal cord; Right, larva showing sparse expression in the spinal cord but relative strong expression in the EmT. In the present study, larvae with expression pattern similar to the right panel were used. (B) Total swimming distance within 5 min in control, Tg(Gal4s1020t,UAS:mCherry) control and Tg(Gal4s1020t,UAS:BoTxBLC-GFP) larvae. Data were the same as in Figure 5G. The numbers in the brackets represent the numbers of larvae examined. (C) Example traces of 5-min swimming in WT control, Tg(Gal4s1020t,UAS:mCherry) control and Tg(Gal41020t,UAS:BoTxBLC-GFP) larvae at 6 dpf. (D) Example images showing two-photon laser-induced lesion of the bilateral EmT in a 6-dpf Tg(Gal4s1020t,UAS:GFP) larva from dorsal to ventral (layer 1 to layer 5, 10 μm per layer). The splice-like line in the middle of images was the boundary between left and right hemispheres. After lesion, bulb-like structures (pink stars) appeared and GFP-positive neurons could not be clearly observed in the EmT. (E) Percentages of ablated neurons within the 5 layers of the EmT. Data were obtained from 6 larvae. Error bars, SEM. (F) Example traces of 5-min swimming in WT control and EmT lesion larvae at 6 dpf. Error bars, SEM. n.s., no significant.