
|
Fig. S4
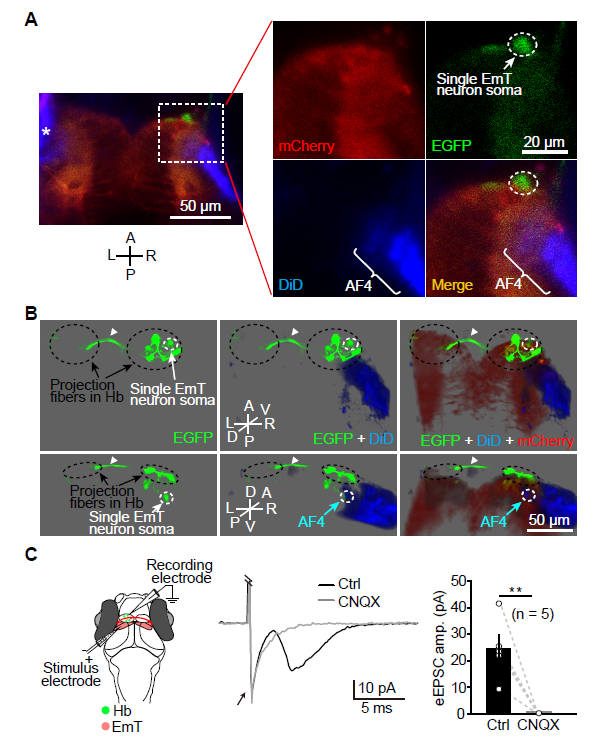
Single Cell Labeling and In Vivo Whole-cell Recording Show Contacts between RGC Axons and EmT Neurons at the AF4, and Synaptic Connections Made by EmT Projection Fibers on Hb Neurons.
(A) Sparse labeling of a single neuron in the R-EmT by transiently expressing EGFP and dense labeling of RGC axons by injecting DiD into the left eye in Tg(Gal4s1020t,UAS:mCherry) larvae. Projected confocal images show that an EGFP-expressing neuron in the EmT region contacts DiD-positive RGC axons (blue) at the AF4. Asterisk, left retina. A, anterior; L, left; P, posterior; R, right. (B) Three-dimensional representation of the case shown in (A). DiD-labeled RGC axons are in blue, an EGFP-expressing EmT neuron is in green, and mCherry-expressing thalamic neurons are in red. The EmT neuron is contacted by RGC axons at the AF4 and sends projection fibers to the ipsilateral R-Hb and then to the contralateral L-Hb via the habenular commissure (arrowhead). A, anterior; D, dorsal; L, left; P, posterior; R, right; V, ventral. (C) In vivo whole-cell recording of L-dHb neurons in response to local electrical stimulation of the ipsilateral EmT. Left, recording diagram; Middle, example traces of electrically evoked EPSCs (eEPSCs) in a L-dHb neuron before and after bath application of CNQX (50 μM). The electrical artifact (arrow) was truncated for clarification. Right, summary. Data obtained from the same neuron are connected by a dashed line. Error bars, SEM. **p < 0.01 (paired two-tailed Student’s t test).