
Image
|
Figure Caption
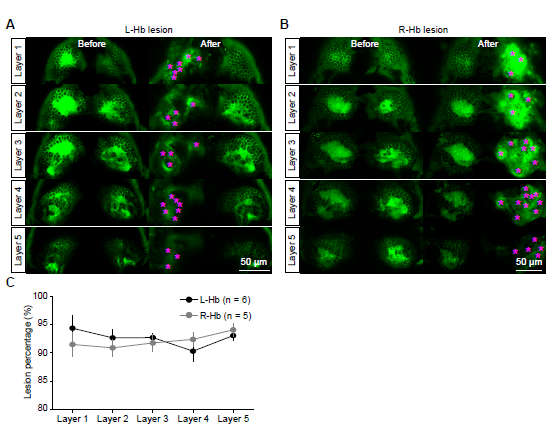
Fig. S1
Confocal Images of Hb Before and After Lesion of L-Hb or R-Hb.
(A and B) Example images showing lesion of the L-Hb (A) and R-Hb (B) in two 6-dpf Tg(gng8:Gal4,UAS:GFP) larvae from dorsal to ventral (layer 1 to layer 5). Blurred image of the left-bottom panel in (A) was induced by animal movement. After lesion, bulb-like structures (stars) appeared and GFP-positive neurons could not be clearly observed. (C) Percentages of ablated neurons within the 5 layers of the L-Hb (black) and R-Hb (grey). Data were obtained from 6 larvae for the L-Hb lesion and 5 larvae for the R-Hb lesion. Error bars, SEM.
Acknowledgments
This image is the copyrighted work of the attributed author or publisher, and
ZFIN has permission only to display this image to its users.
Additional permissions should be obtained from the applicable author or publisher of the image.
Full text @ Neuron