
|
Fig. 4
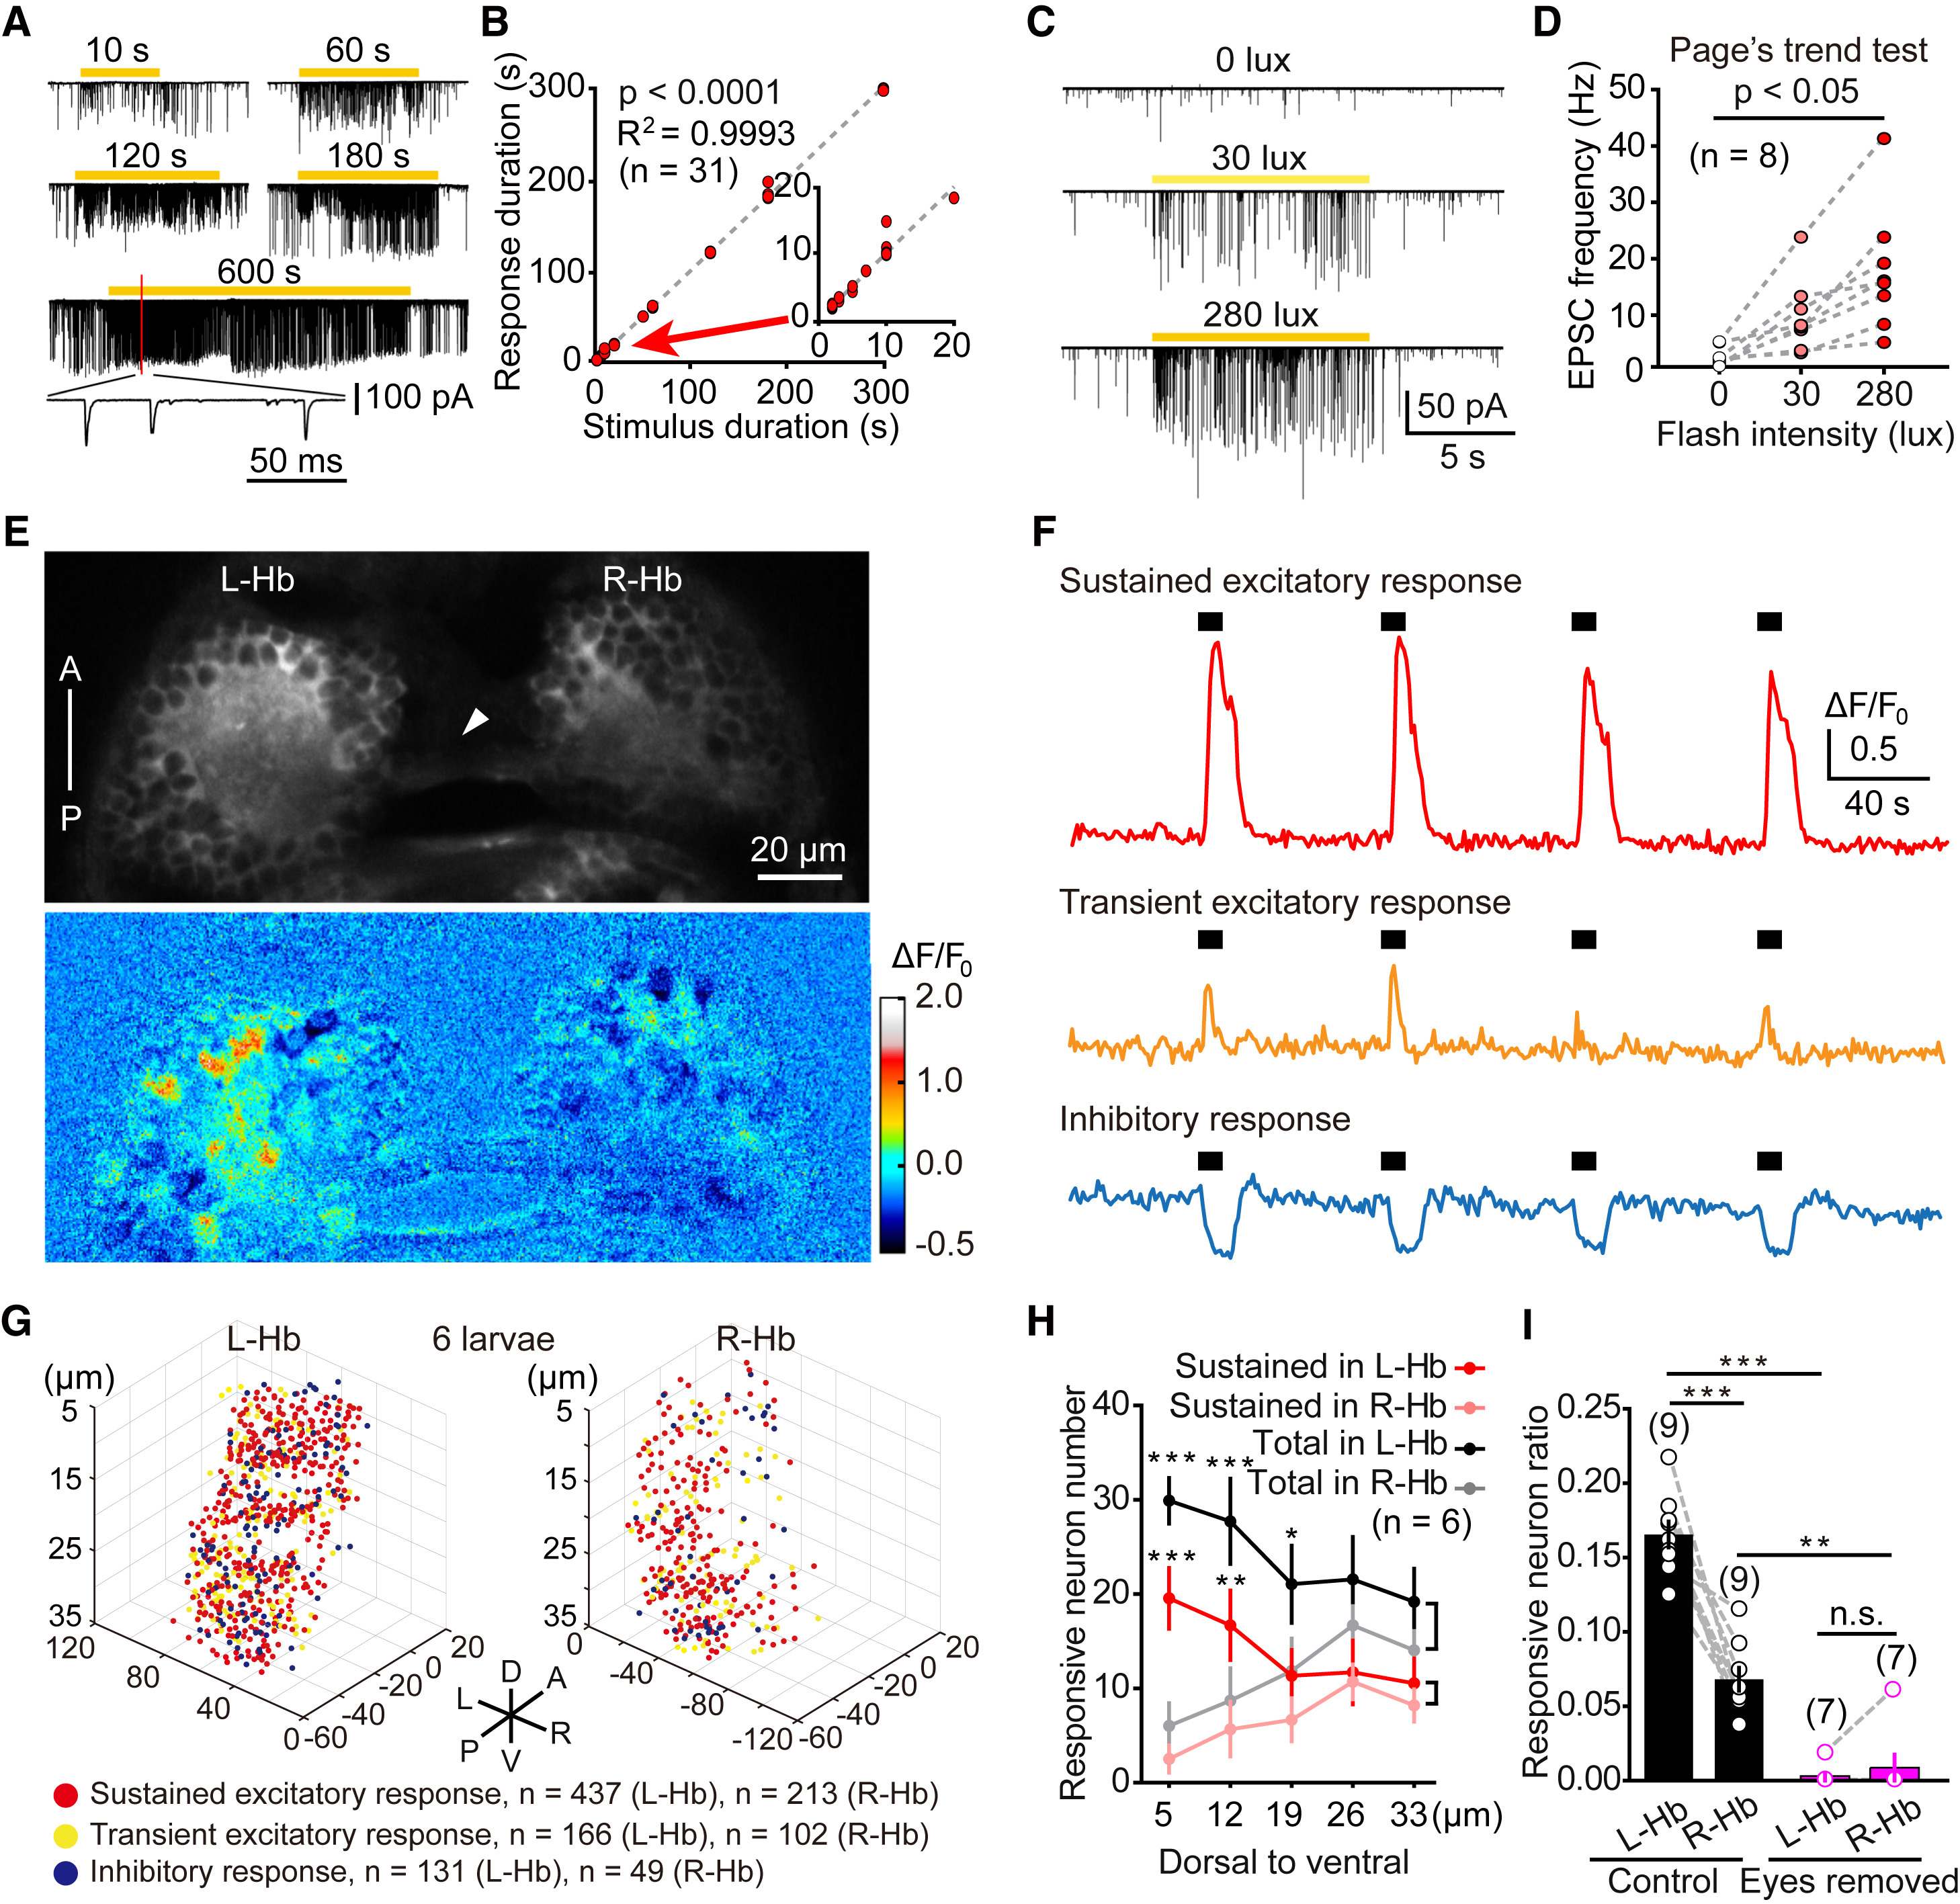
L-dHb Neurons Encode the Presence and Intensity of Ambient Light
(A) Example traces showing sustained visual responses of a L-dHb neuron evoked by light flash stimuli with different durations in a 6-dpf larva. Visually evoked excitatory postsynaptic currents (EPSCs) were monitored with in vivo whole-cell recording when the cell was held at the reversal potential of Cl− (ECl−, −60 mV). Inset, individual EPSCs.
(B) Plot of the light stimulus duration to the neuron response duration. Positive correlation is shown between the two variables. Part of the plot (from 0 to 20 s) was enlarged in the inset. The line represents linear regression with p < 0.0001.
(C) Example traces showing sustained visual responses of a L-dHb neuron evoked by light flash stimuli with different intensities.
(D) Plot of the flash intensity to the frequency of individual EPSCs in visually evoked EPSCs. Data obtained from the same neuron are connected by a dashed line.
(E) In vivo confocal calcium imaging of the middle layer of the Hb (19 μm away from the dorsal epidermis) in a 6-dpf Tg(HuC:GCaMP5.0)ion13dTg larva in response to a 10 s flash. Top: raw image; bottom: heatmap of visually evoked calcium activities. Arrowhead, habenular commissure. A, anterior; P, posterior.
(F) Example cases showing that three L-Hb neurons in a 6-dpf larva exhibited sustained excitatory, transient excitatory, and inhibitory calcium activities evoked by 10 s flashes (black thick lines), respectively.
(G) Three-dimensional spatial distribution of neurons with three types of visual responses in both the whole L-Hb and R-Hb. 10 s flashes were used. All data from 6 larvae at 5 to ∼6 dpf were plotted in one coordinate. Red dot, neuron showing sustained excitatory responses; yellow dot, neuron showing transient excitatory responses; blue dot, neuron showing inhibitory response. The coordinate origin (0, 0, 0) corresponds to the position (middle line, anterior of Hb, dorsal of Hb). A, anterior; D, dorsal; L, left; P, posterior; R, right; V, ventral.
(H) Average numbers of visually responsive neurons in each layer (from dorsal to ventral, 7 μm/layer) of the L-Hb and R-Hb. Black line, all responsive L-Hb neurons; gray line, all responsive R-Hb neurons; red line, sustained excitatory responsive L-Hb neurons; reddish line, sustained excitatory responsive R-Hb neurons. For both the all responsive neurons and sustained excitatory responsive neurons, the numbers in the first two dorsal layers of the L-Hb are significantly larger than those in the R-Hb. The data are the same with those in (G).
(I) Ratio of visually responsive neurons in the L-Hb and R-Hb of control and bilateral eyes-removed larvae. Data obtained from the same larva are connected by a dashed gray line.
The numbers in the parentheses represent the numbers of Hb neurons (B, D, and G) or larvae (H and I) examined. Error bars, SEM n.s., not significant; ∗p < 0.05, ∗∗p < 0.01, ∗∗∗p < 0.001 (Page’s trend test for D; unpaired two-tailed Student’s t test for H; paired two-tailed Student’s t test for comparison between the same group’s L-Hb and R-Hb in I; Mann-Whitney test for comparison between control and eyes removed in I).
See also Figure S3.