
|
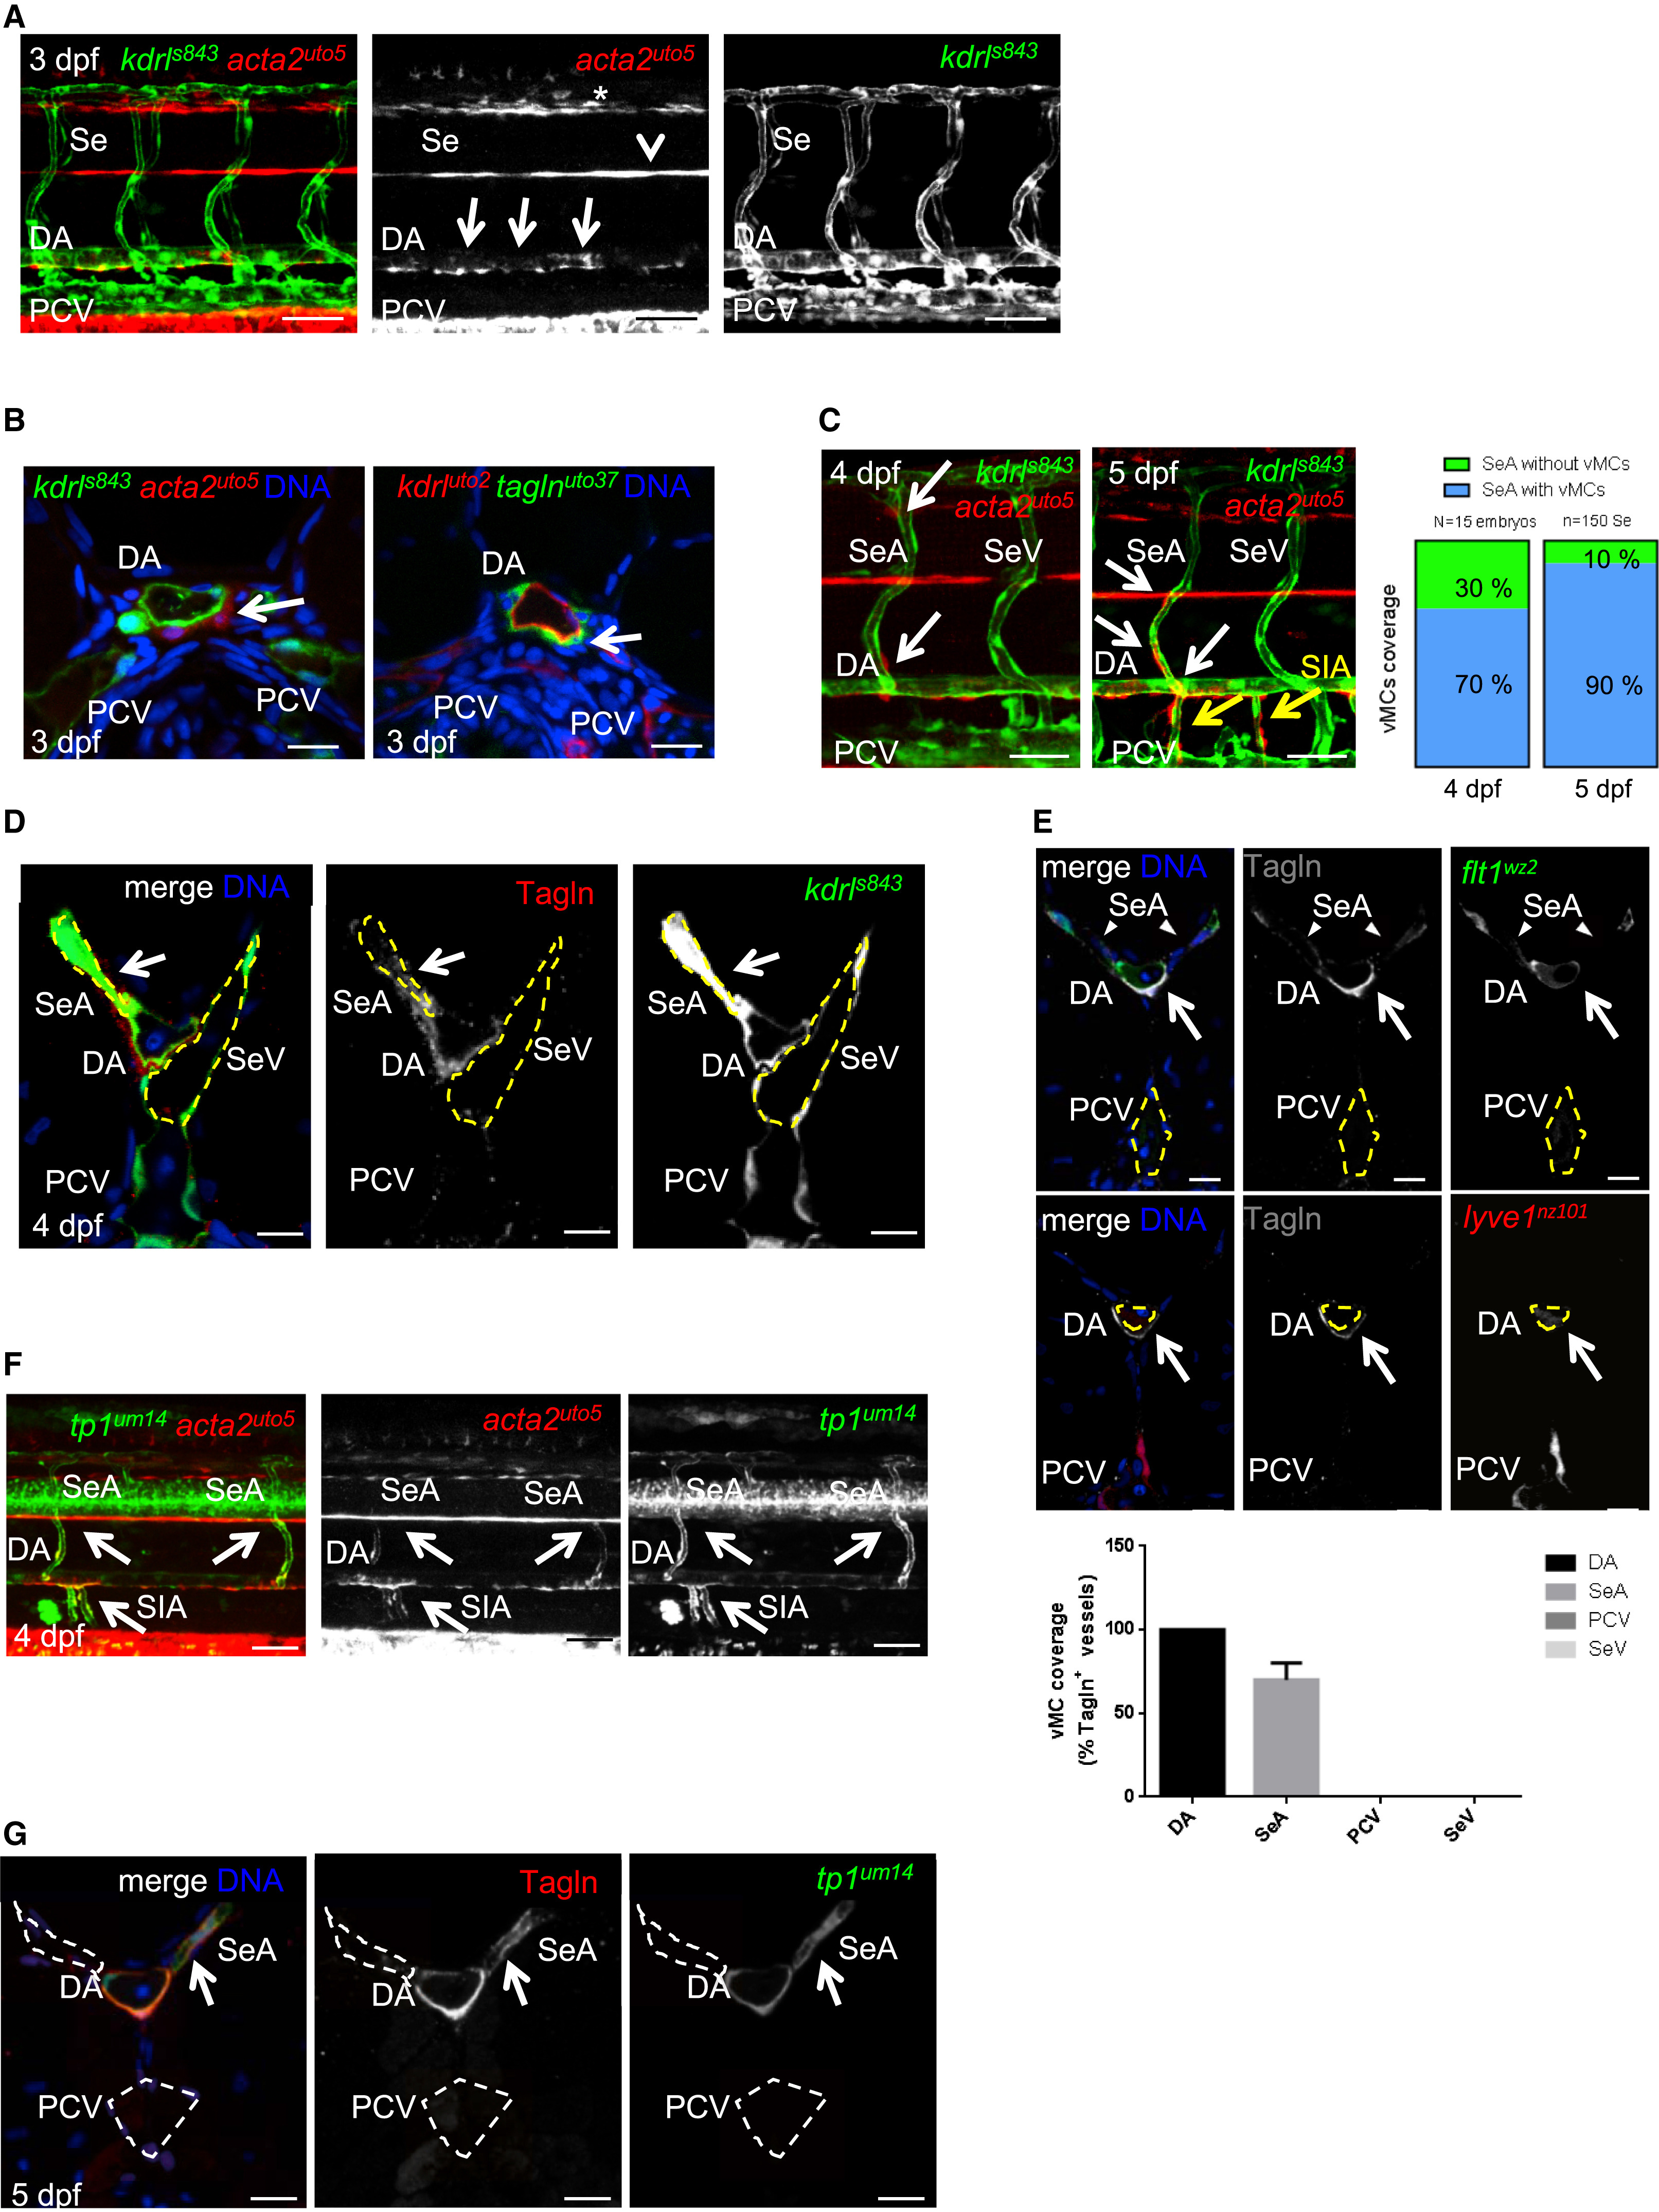
Fig. 1
Zebrafish vMCs Are Recruited around Arterial-Fated Vessels of Developing Vasculature
(A) DA, but not PCV, is covered by vMCs (red, arrow). Partial z-projection of the trunk region (somite 8–14) of a Tg(kdrl:egfp)s843; Tg(acta2:mCherry)uto5 embryo at 3 dpf. Merged and single channels are shown. mCherry expression is also detected in the lateral line (arrowhead) and floor plate (star). Scale bar, 100 μm.
(B) Confocal transverse sections of the DA of Tg embryos of the indicated genotype. Both Tg(acta2:mCherry)uto5 and Tg(tagln:CAAX-egfp)uto37 lines mark vMCs located in the ventral side of the DA (arrow). Blue, nuclei. Scale bar, 25 μm.
(C) vMCs are recruited only by segmental arteries. At 4 and 5 dpf, vMCs progressively cover SeAs but not SeVs (arrows). The graph shows the percentage of SeAs covered by vMCs in the trunk. By 5 dpf, supraintestinal arteries (SIAs) are also covered by vMCs (yellow arrows). Data are represented as mean ± SD. Scale bar, 50 μm.
(D) Confocal transverse sections of the trunk region of Tg(kdrl:egfp)s843 embryos stained for Tagln (red). vMCs are located only around SeAs but not SeVs. Blue, nuclei. Scale bar, 25 μm.
(E) Quantification of vMC coverage in arterial and venous zebrafish vessels. Double Tg Tg(flt1:Mmu.Fos-EGFP)wz2;Tg(−5.2lyve1b:DsRed)nz101 zebrafish embryos expressing EGFP in arteries and dsRed2 in veins (Nicenboim et al., 2015) were stained with the vMC marker Tagln (gray) of 4 dpf. A total number of five z-stacks for 10 embryos were analyzed. Histograms show the percentage of vessels covered by vMCs compared to the total number counted for each category. No vMCs were found around veins in all experimental conditions. Data are represented as mean ± SD.
(F) vMCs are located only around arterial endothelial cells (arrows). Partial z-projection of the trunk region (somite 8–14) of Tg(acta2:mCherry)uto5; Tg(tp1:egfp)um14. Merged and single confocal channels are shown. Scale bar, 100 μm.
(G) Confocal transverse sections of the trunk region of Tg(tp1:egfp)um14 stained for Tagln (red). vMCs are positioned only around tp1-positive SeA vessels (arrows). Blue, nuclei. Scale bar, 25 μm.
See also Figures S1 and S2.