
|
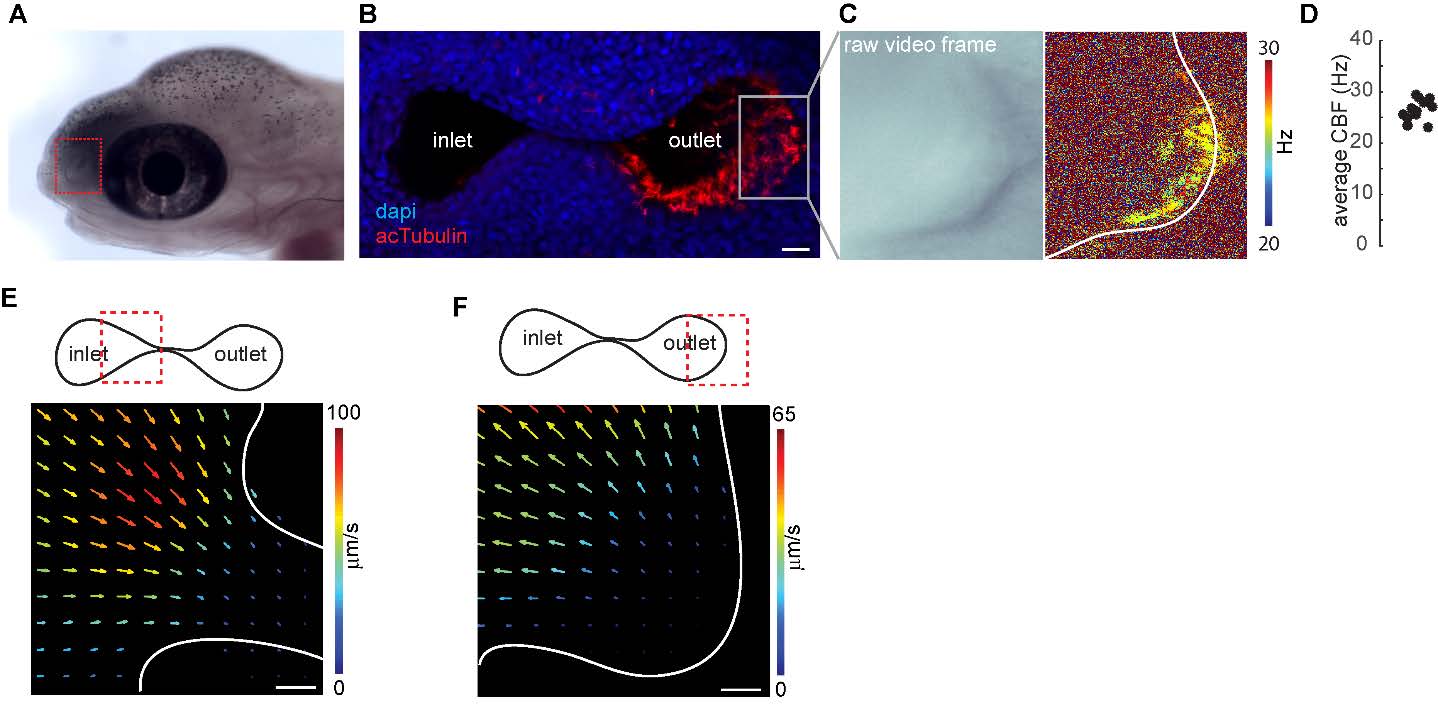
Fig. S2
Multiciliated cells in the nose pit of salmon larvae are spatially organized, beat at a distinct frequency and generate a stereotypical flow. Related to Figures 1 and 2.
(A) Representative picture of a salmon larvae 4 days post hatching. The nose pit is indicated by a red inlet. (B) Confocal microscopy image of the nose pit, where all cilia are labelled by acetyl tubulin staining (red) and cell nuclei are labelled with DAPI staining (blue). The nose pit is composed of one anterior and one posterior opening connected by one channel. Note the enrichment of acetyl tubulin positive motile cilia at the posterior opening. (C) 100Hz transmission microscopy recordings in the posterior opening of the nose pit (indicated by the inlet on the confocal image) of a representative animal (left) showed that motile cilia beat at frequencies of about 25Hz (right, nose cavity is indicated with a white line). (D) Average ciliary beating frequency from 6 salmon larvae at 2 different locations range from 23.1 to 29.3Hz, with a mean of 26.5 +/-2 Hz. (E-F) Flow fields were calculated by particle image velocimetry in confocal microscopy measurements (19.6 Hz) of fluorescent particles around the nose pits at the inlet (E) and outlet (F). Nose pits are indicated by white lines. Imaging plane viewed from dorsal. Warm colors and large arrows indicate strong flow. Direction of the arrows indicate the direction of the flow. Note that the stereotypical flow fields generated by motile cilia attract water through the inlet to the outlet. Red inlet in the scheme on the top depicts the imaged region. Scale bars are 20μm.