
|
Fig. 4
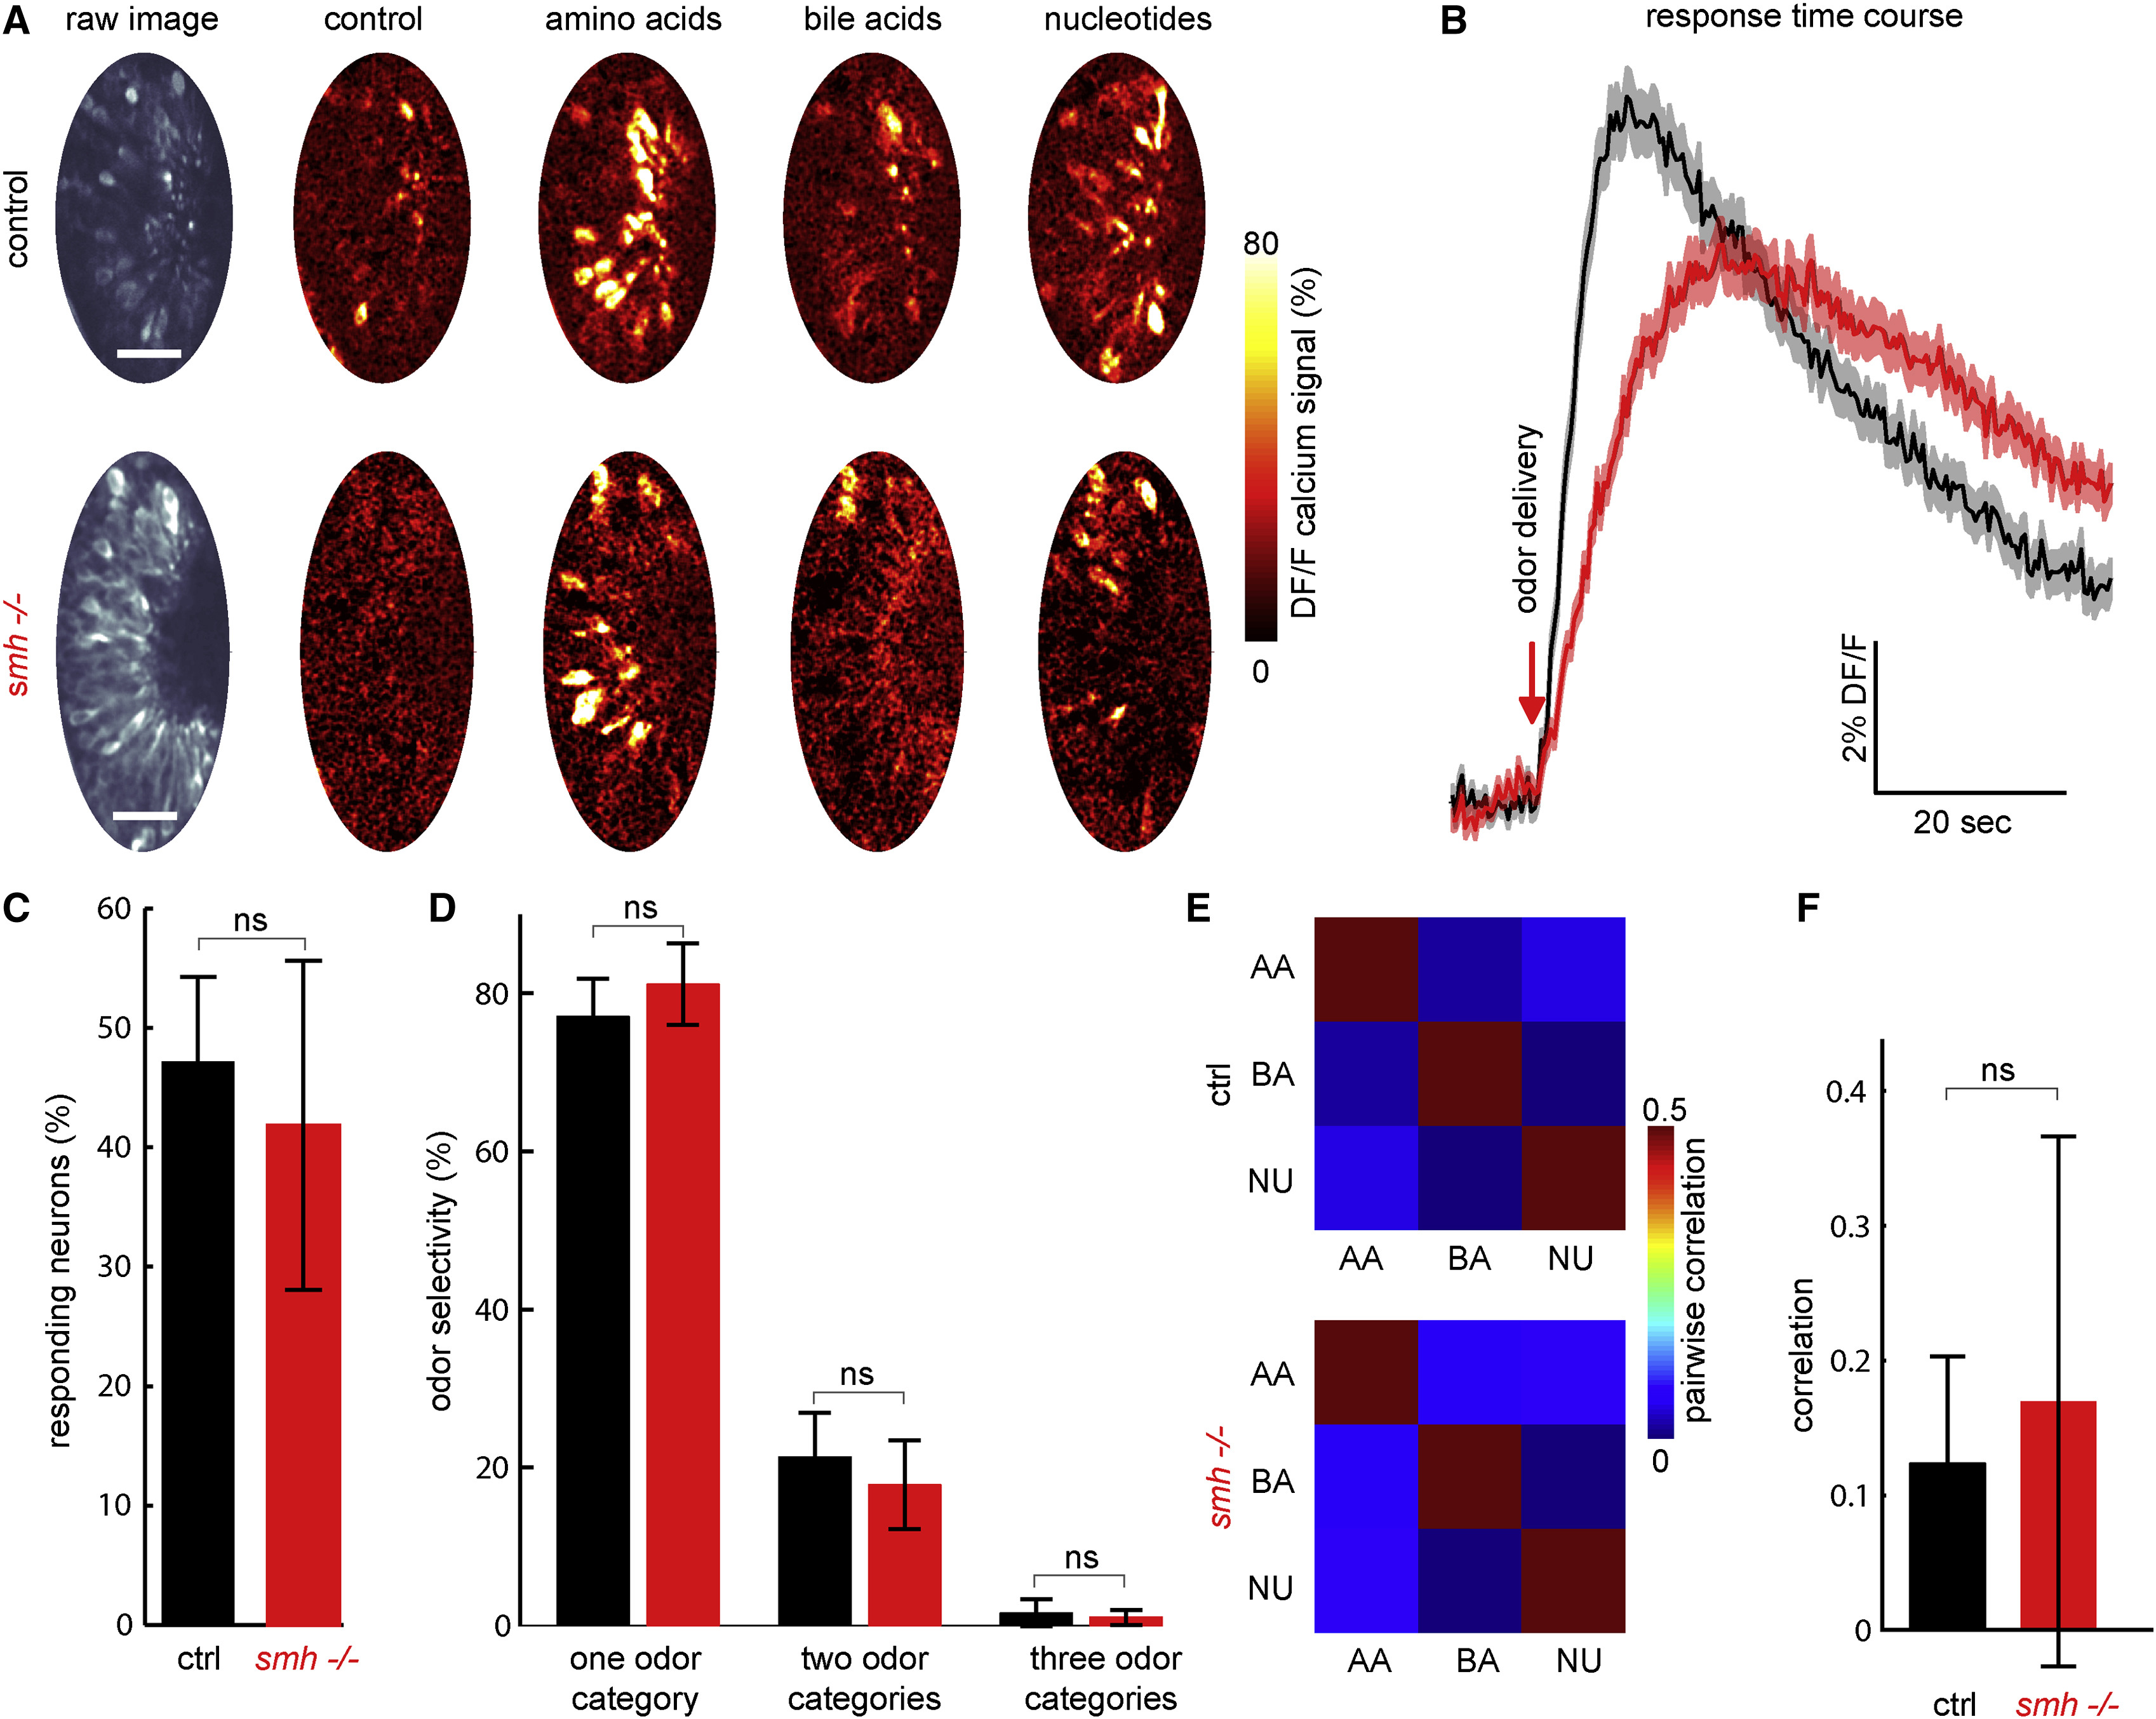
No Significant Differences Were Observed in the Odor Coding of ORNs in smh−/− Zebrafish When Long, 20 s Odor Pulses Are Presented with Constant Flow
(A) Control and smh−/− 4-day-old zebrafish larvae expressing HuC:GCamp6s were exposed to three major odor categories: amino acids, bile acids, and nucleotides. Representative images show neural responses in the form of relative change in fluorescent intensity (DF/F) in GCamP6s signals of ORNs in control and smh−/− larvae. Scale bars represent 25 μm.
(B) Average responses of all individual ORNs show slower kinetics of response in smh−/− larvae (red) when compared to control (black).
(C) The ratio of odor-responding ORNs is not significantly different in smh−/− versus control animals in long odor pulses with constant flow. ORNs are considered odor responding if their calcium responses are 2 SD above the mean activity during baseline.
(D) Odor selectivity of responding ORNs to one, two, or three of presented odor categories is not significantly different in smh−/− larvae when compared to control animals.
(E and F) Odor category selectivity is further quantified by calculating pairwise correlations of odor representations across hundreds of individual ORNs. (E) Average correlation matrices and (F) comparison of pairwise odor correlations in individual animals suggest no change in odor selectivity in control versus smh−/− larvae. n = 6 (controls) and n = 5 (smh−/−).
Error bars indicate the SD (p value by rank-sum test; ns, non-significant).