
|
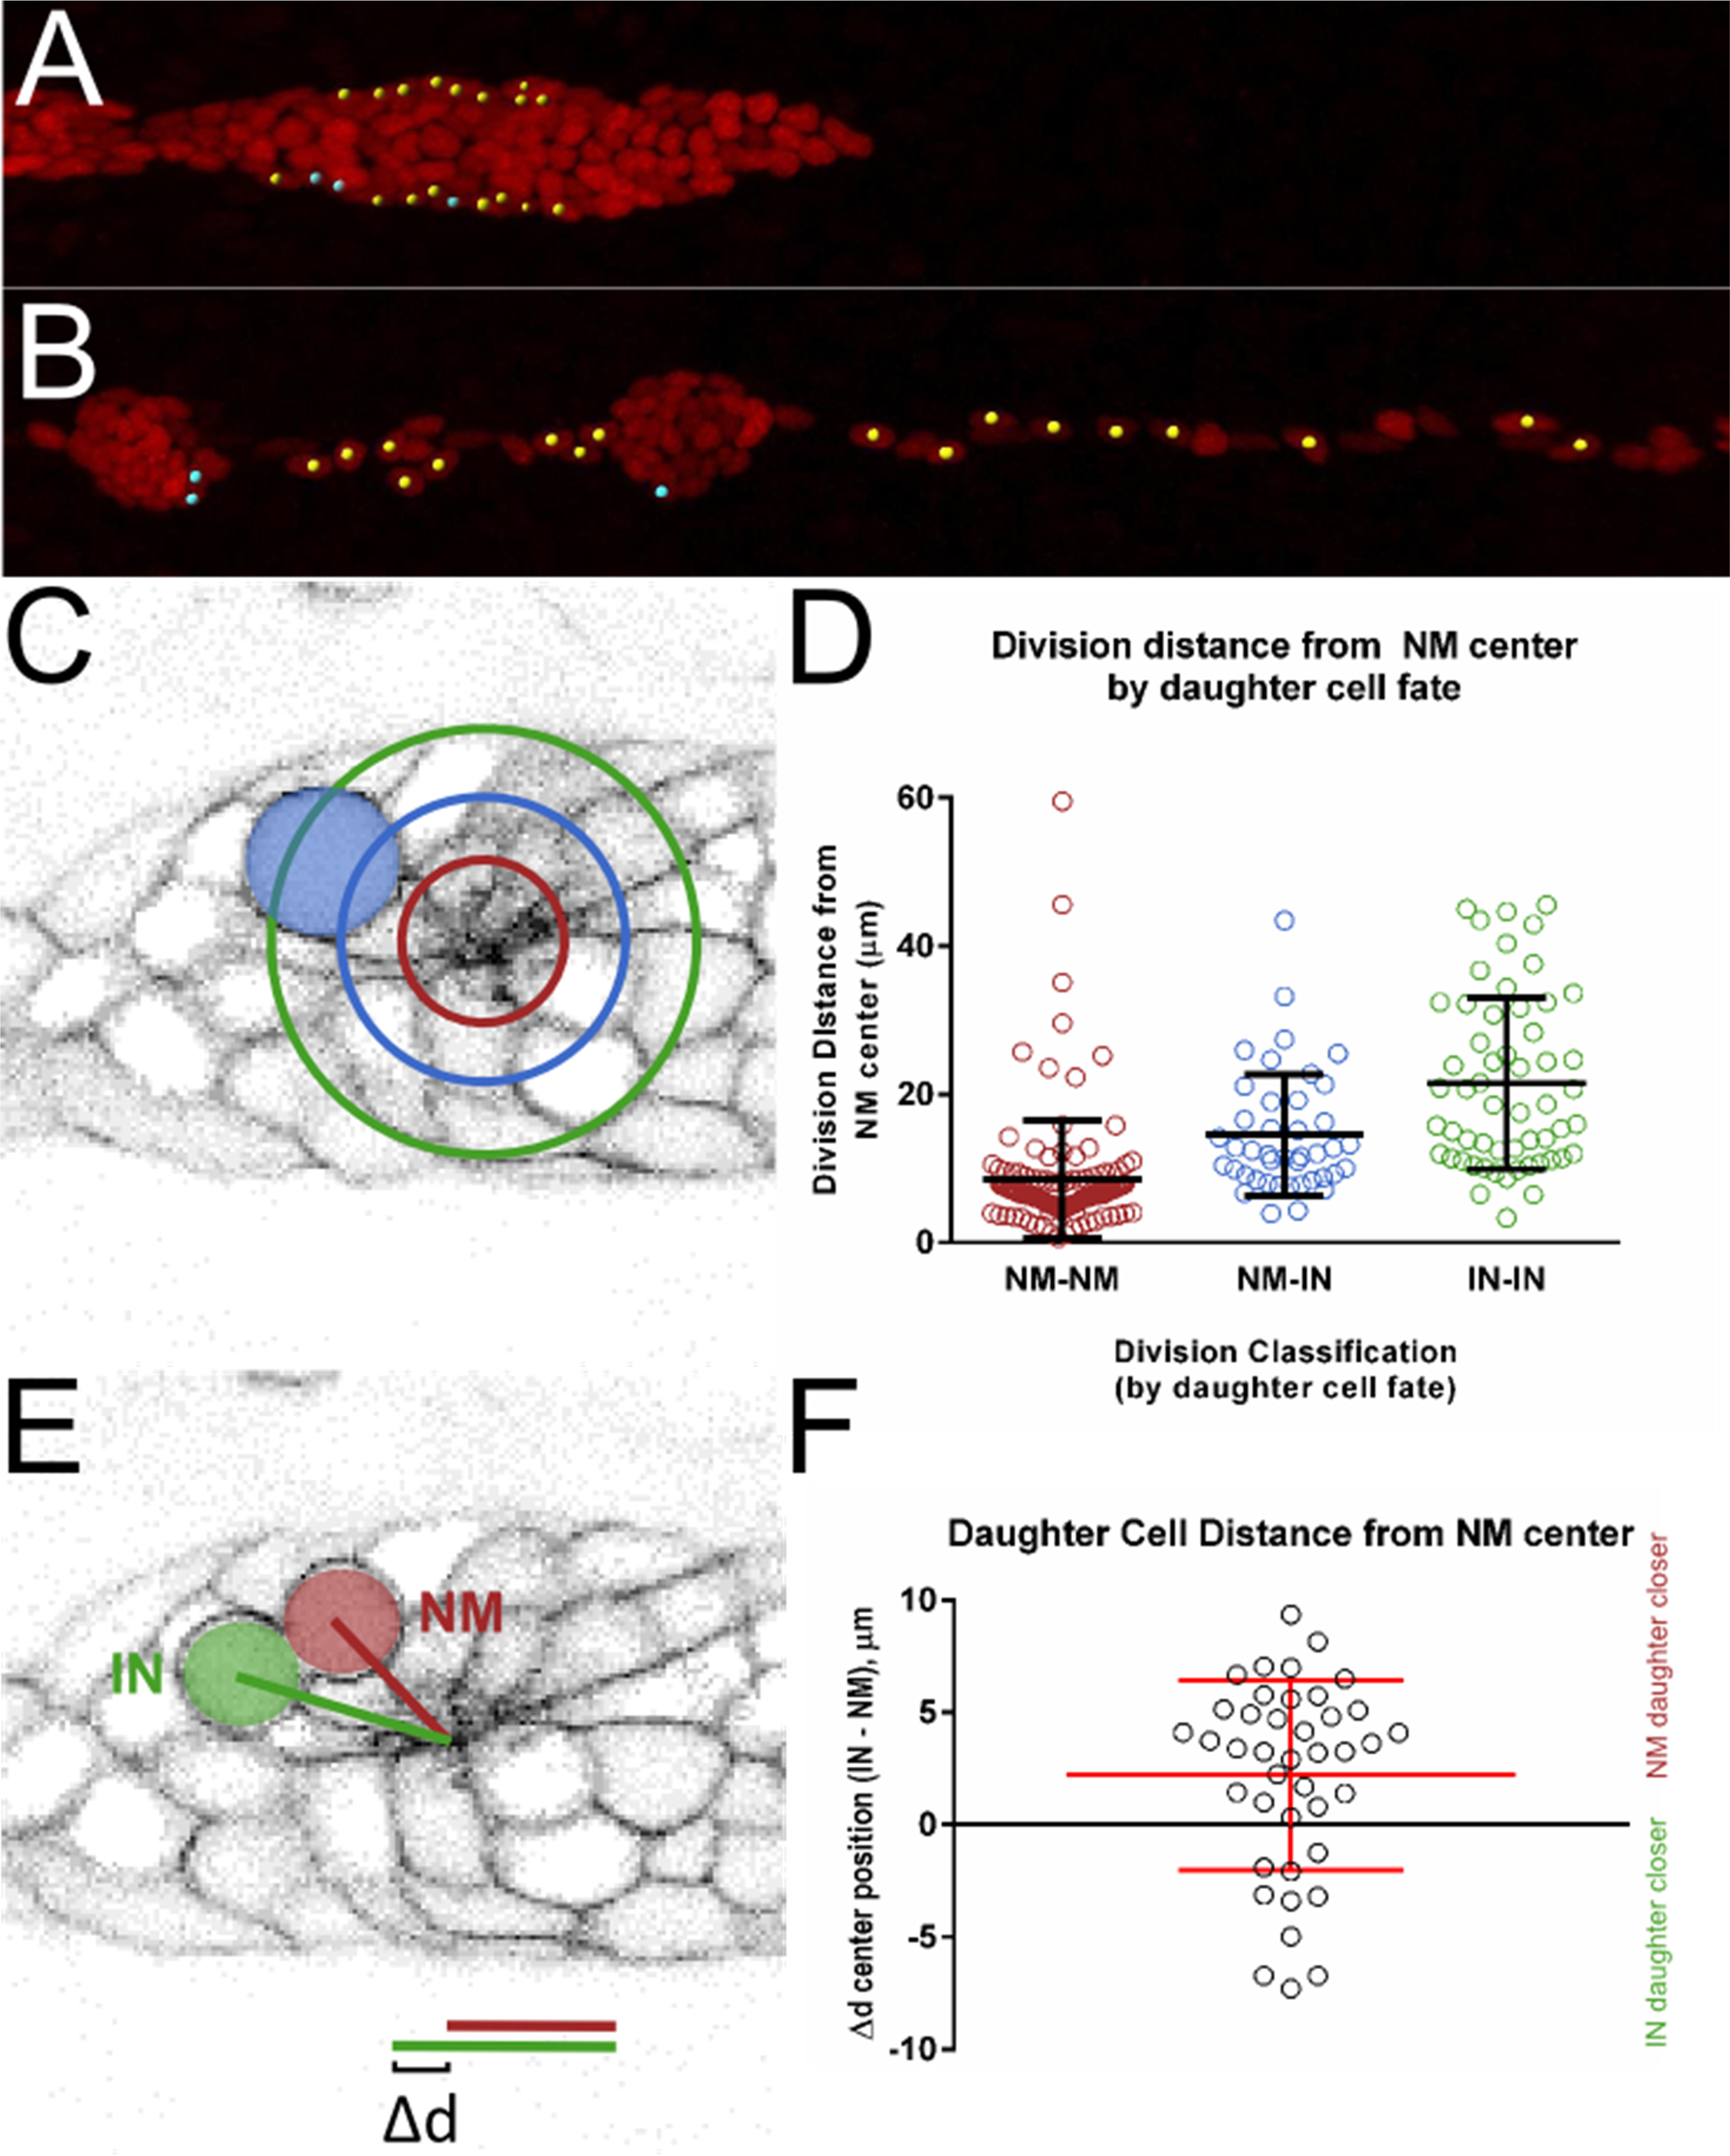
Fig. 5
Position of dividing cells by distance from the center of neuromasts. A, B frames from timelapse movie showing position of future interneuromast cells within the PLLp. Yellow dots mark interneuromast cells, blue dots mark peripheral support cells within the neuromast. Only one movie out of three that were tracked is shown. C Average radial distance from center of neuromast of divisions classified by division type (red NM-NM, green IN-IN and blue NM-IN. D Quantification of radial distance of division from neuromasts center by cell fate. p<0.0001, one-way ANOVA. E Schematic of distance from center of neuromast for NM and IN cells immediately after a NM-IN division. Δd is calculated by the difference in the distance between IN and NM cells. F Plot of Δd for all cells. Positive values indicate NM-fated daughter cell closer to NM center, negative values indicate IN-fated daughter cell closer to NM center.
Reprinted from Developmental Biology, 422(1), Nogare, D.D., Nikaido, M., Somers, K., Head, J., Piotrowski, T., Chitnis, A., In toto imaging of the migrating Zebrafish lateral line primordium at single cell resolution, 14-23, Copyright (2017) with permission from Elsevier. Full text @ Dev. Biol.