
|
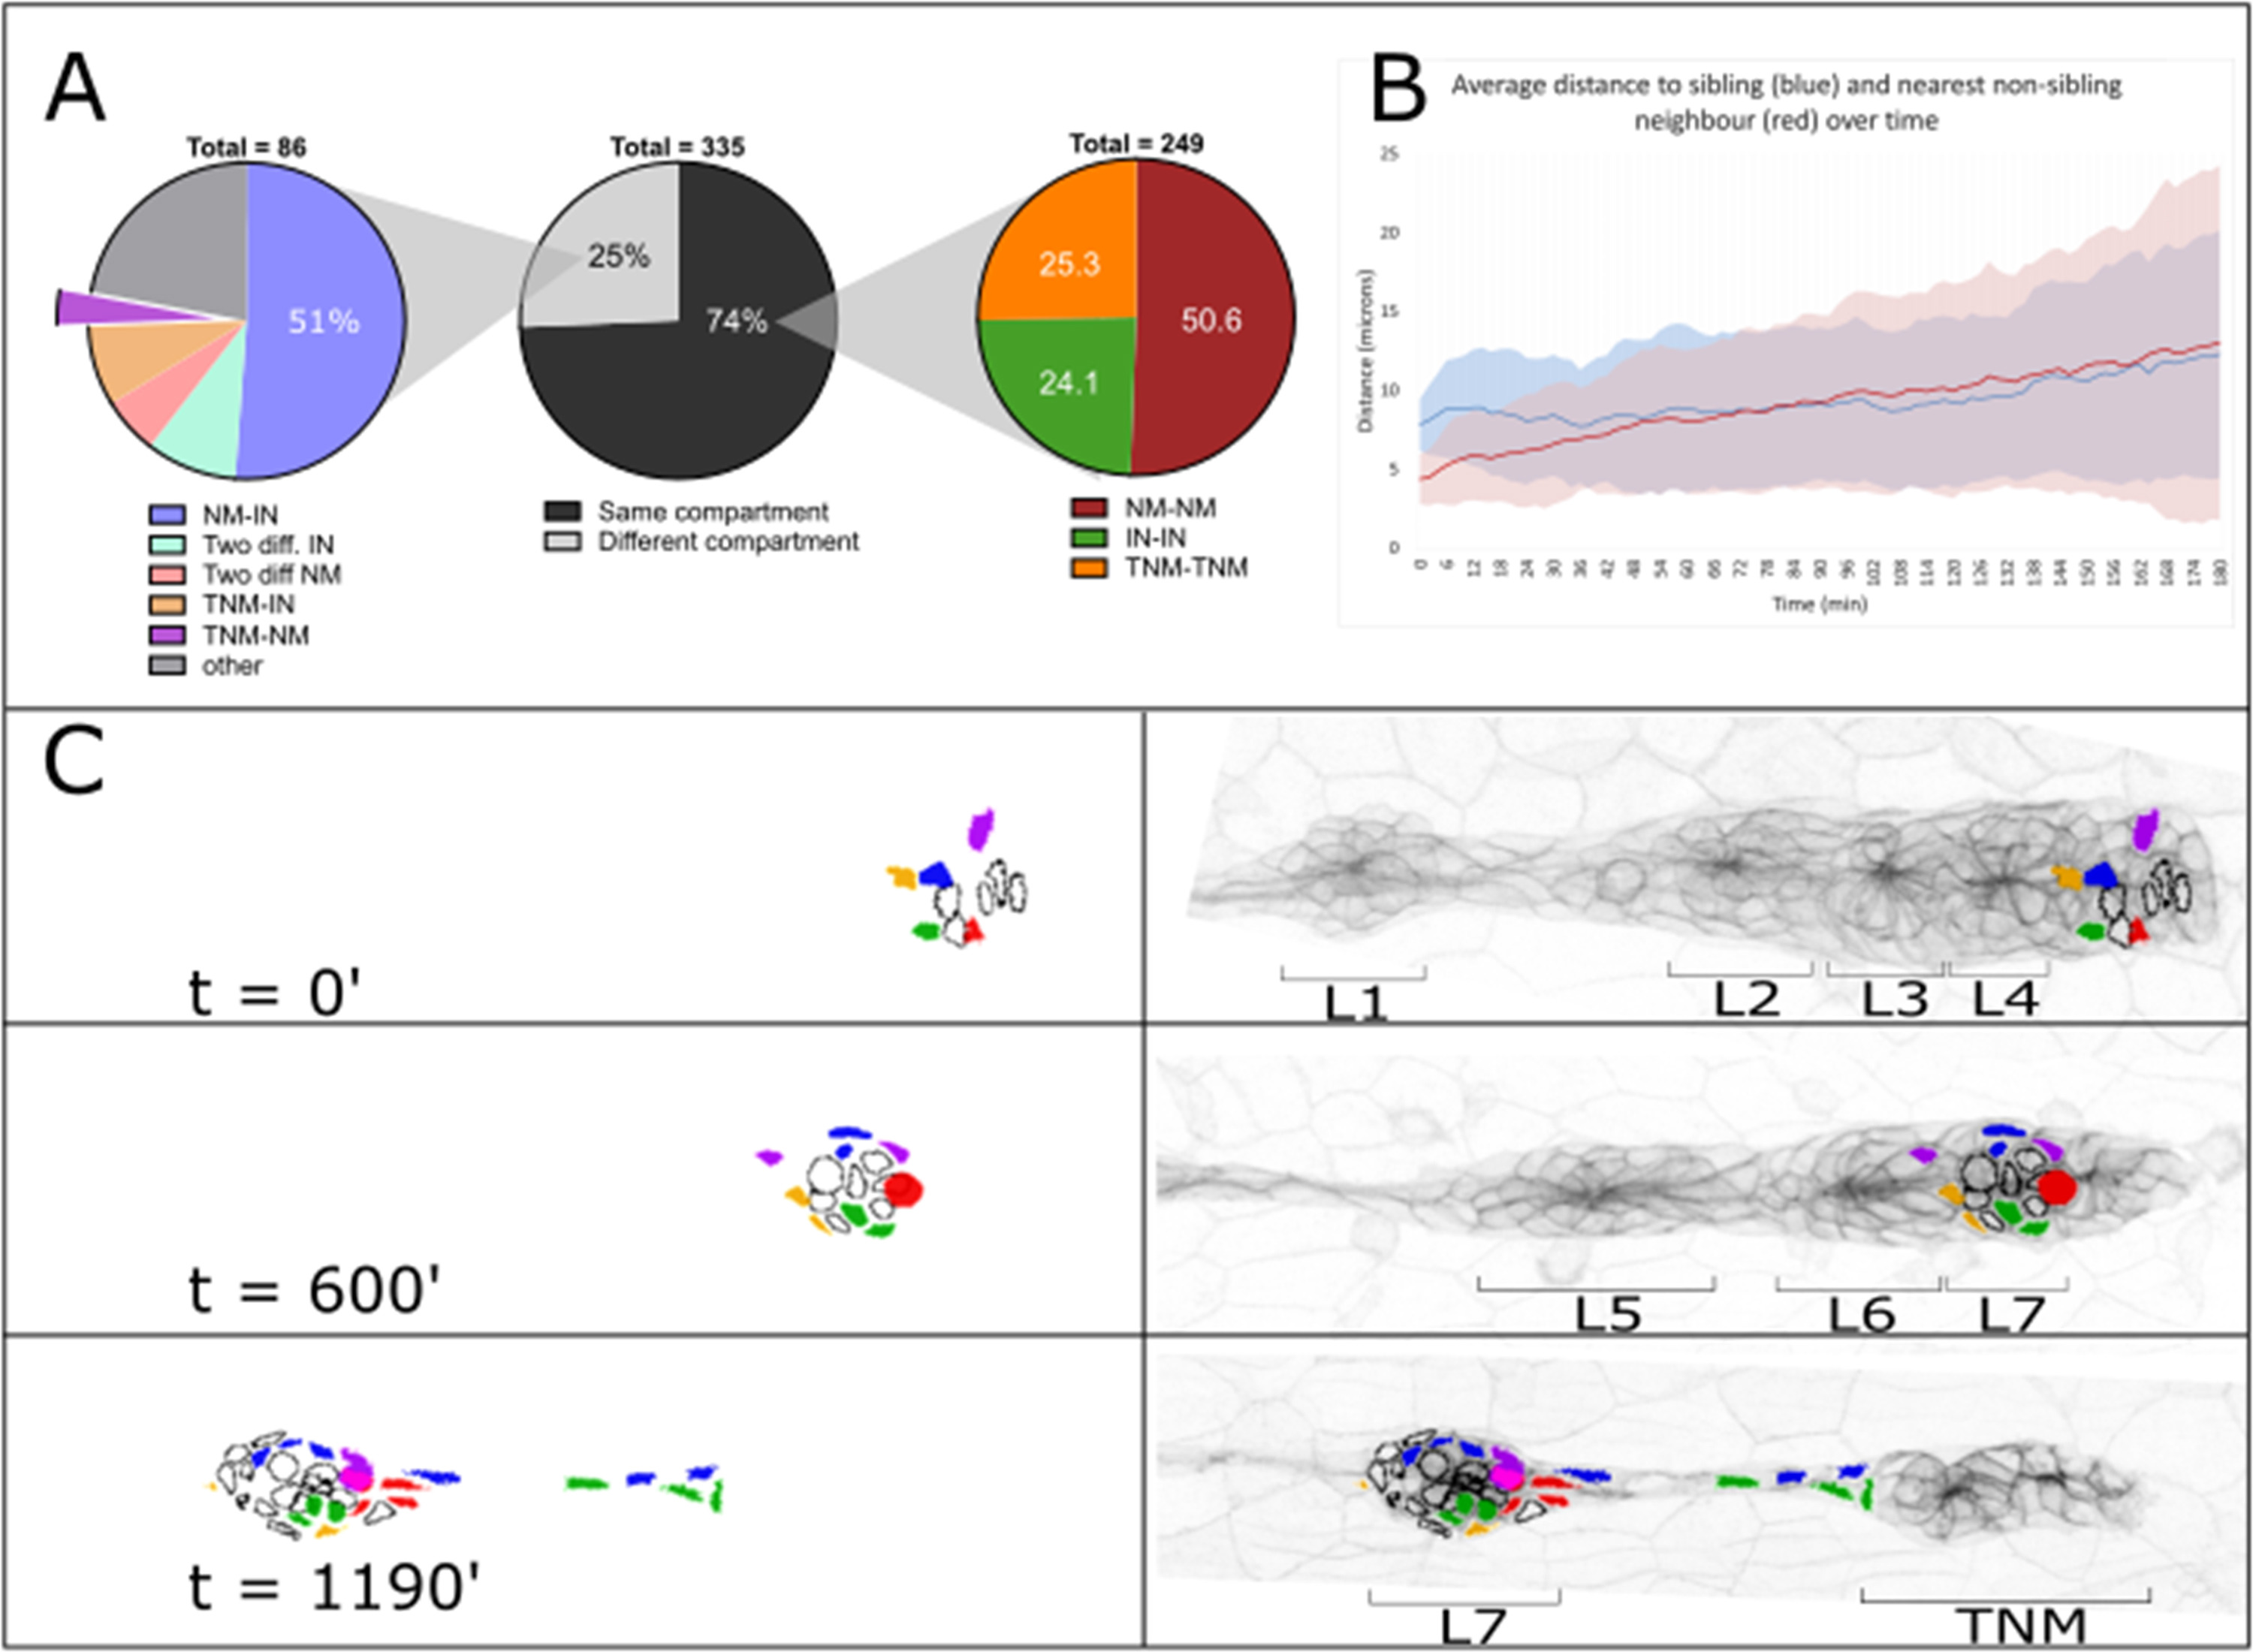
Fig. 4
Quantification of cell fate in the PLLp. A Pie charts of cell divisions classified by daughter cell fate. Center panel: Divisions classified by whether both daughters contribute to the same (black) or different (grey) structures in the LL. Right panel: same-fate divisions classified by compartment (NM, IN or TNM). Left panel: different-fate divisions classified by eventual fate of daughter cells. Expanded wedge represents divisions where one daughter cell remains in the terminal cluster and another is deposited in a non-terminal neuromast. “Other” represents divisions in which daughters themselves undergo divisions. B Plot of average separation distance following division over time between sibling cells (blue) and between dividing cell and nearest non-neighbor sibling. Shaded regions represent one standard deviation. C Frames from movie reconstruction showing all cell lineages that will contribute to the L7 neuromast. Black outlined cells represent lineages in which all daughters will contribute exclusively to L7, colored lineages represented three lineages which will contribute to L7 as well as additional compartments (primarily the L7-TNM interneuromast cell population).
Reprinted from Developmental Biology, 422(1), Nogare, D.D., Nikaido, M., Somers, K., Head, J., Piotrowski, T., Chitnis, A., In toto imaging of the migrating Zebrafish lateral line primordium at single cell resolution, 14-23, Copyright (2017) with permission from Elsevier. Full text @ Dev. Biol.