
|
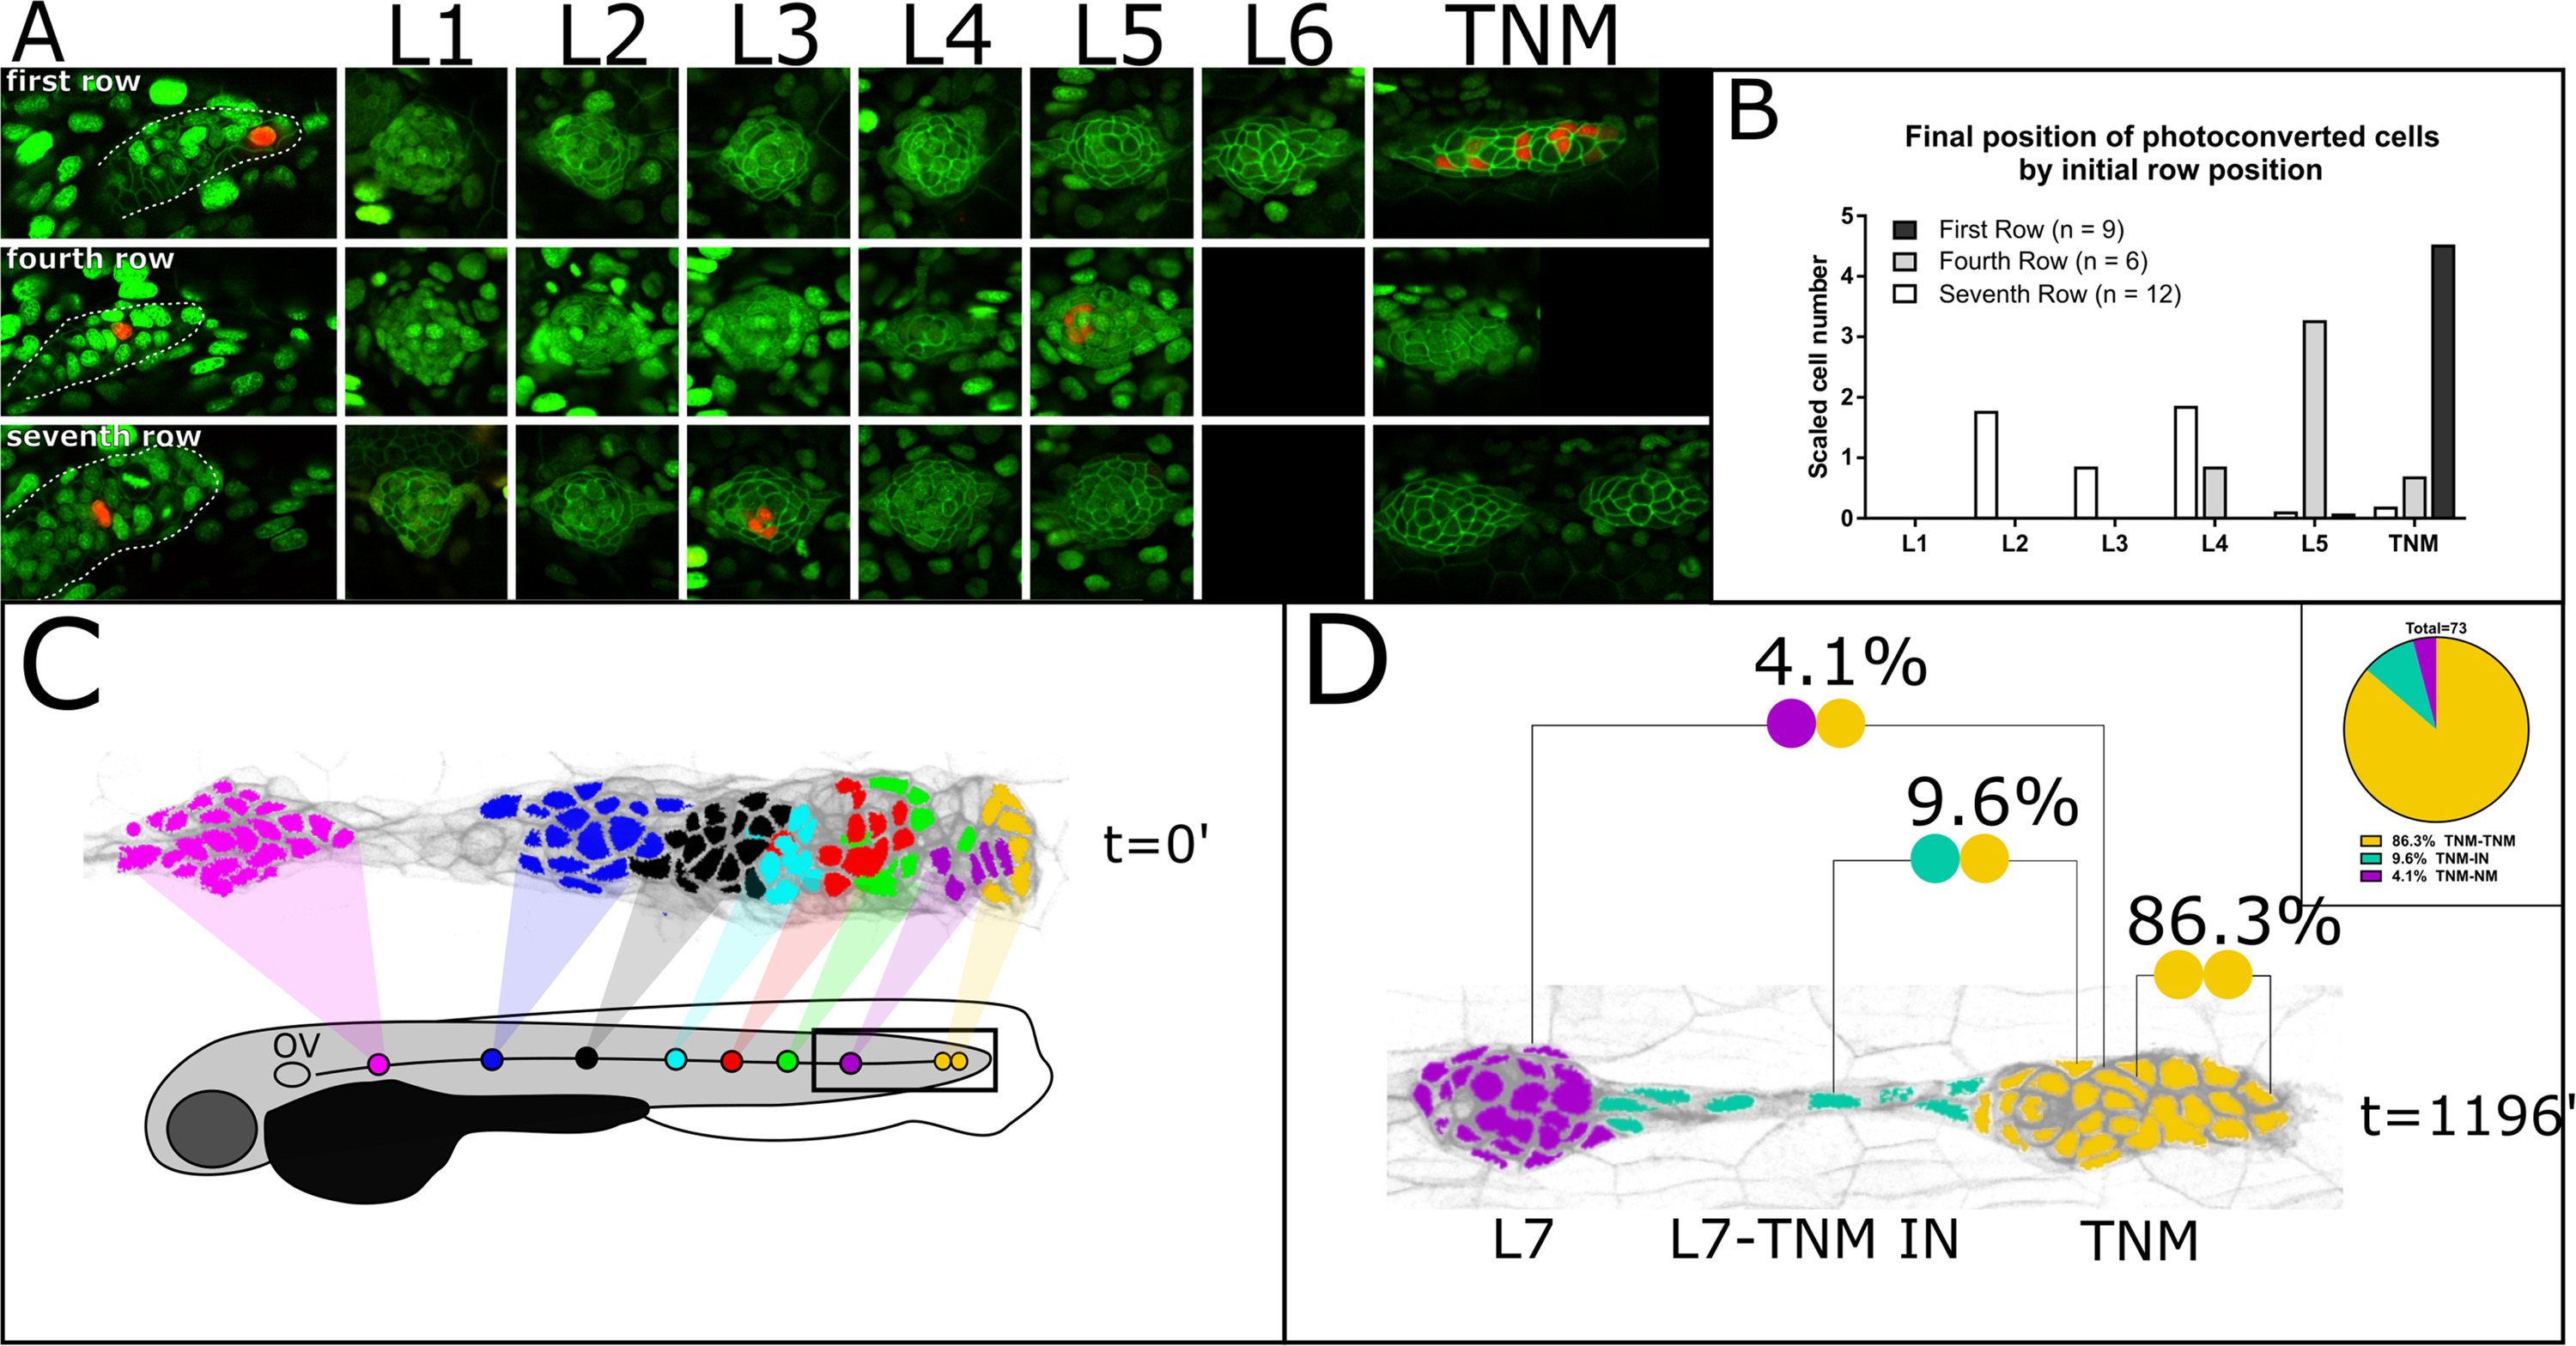
Fig. 3
Spatial pattern of cell fate the lateral line primordium. A. Photoconversion of single cells in the first, fourth and seventh row of the PLLp at 22hpf (left-most panel), and subsequent position of cells in the formed lateral line at 48hpf (right panels). B. Quantification of cell fate from photoconversion data in A. C Fate of cells in PLLp at L1 deposition color coded by neuromast number. Uncolored cells are either Different Fate (DF) cells or interneuromast cells. D Division classes in lineages contributing to the terminal neuromast cluster (yellow). The proportion of each indicated division is shown in the inset. Only a small percentage of lineages contribute to both the terminal cluster and to a more trailing neuromast (in this case, L7).
Reprinted from Developmental Biology, 422(1), Nogare, D.D., Nikaido, M., Somers, K., Head, J., Piotrowski, T., Chitnis, A., In toto imaging of the migrating Zebrafish lateral line primordium at single cell resolution, 14-23, Copyright (2017) with permission from Elsevier. Full text @ Dev. Biol.