
|
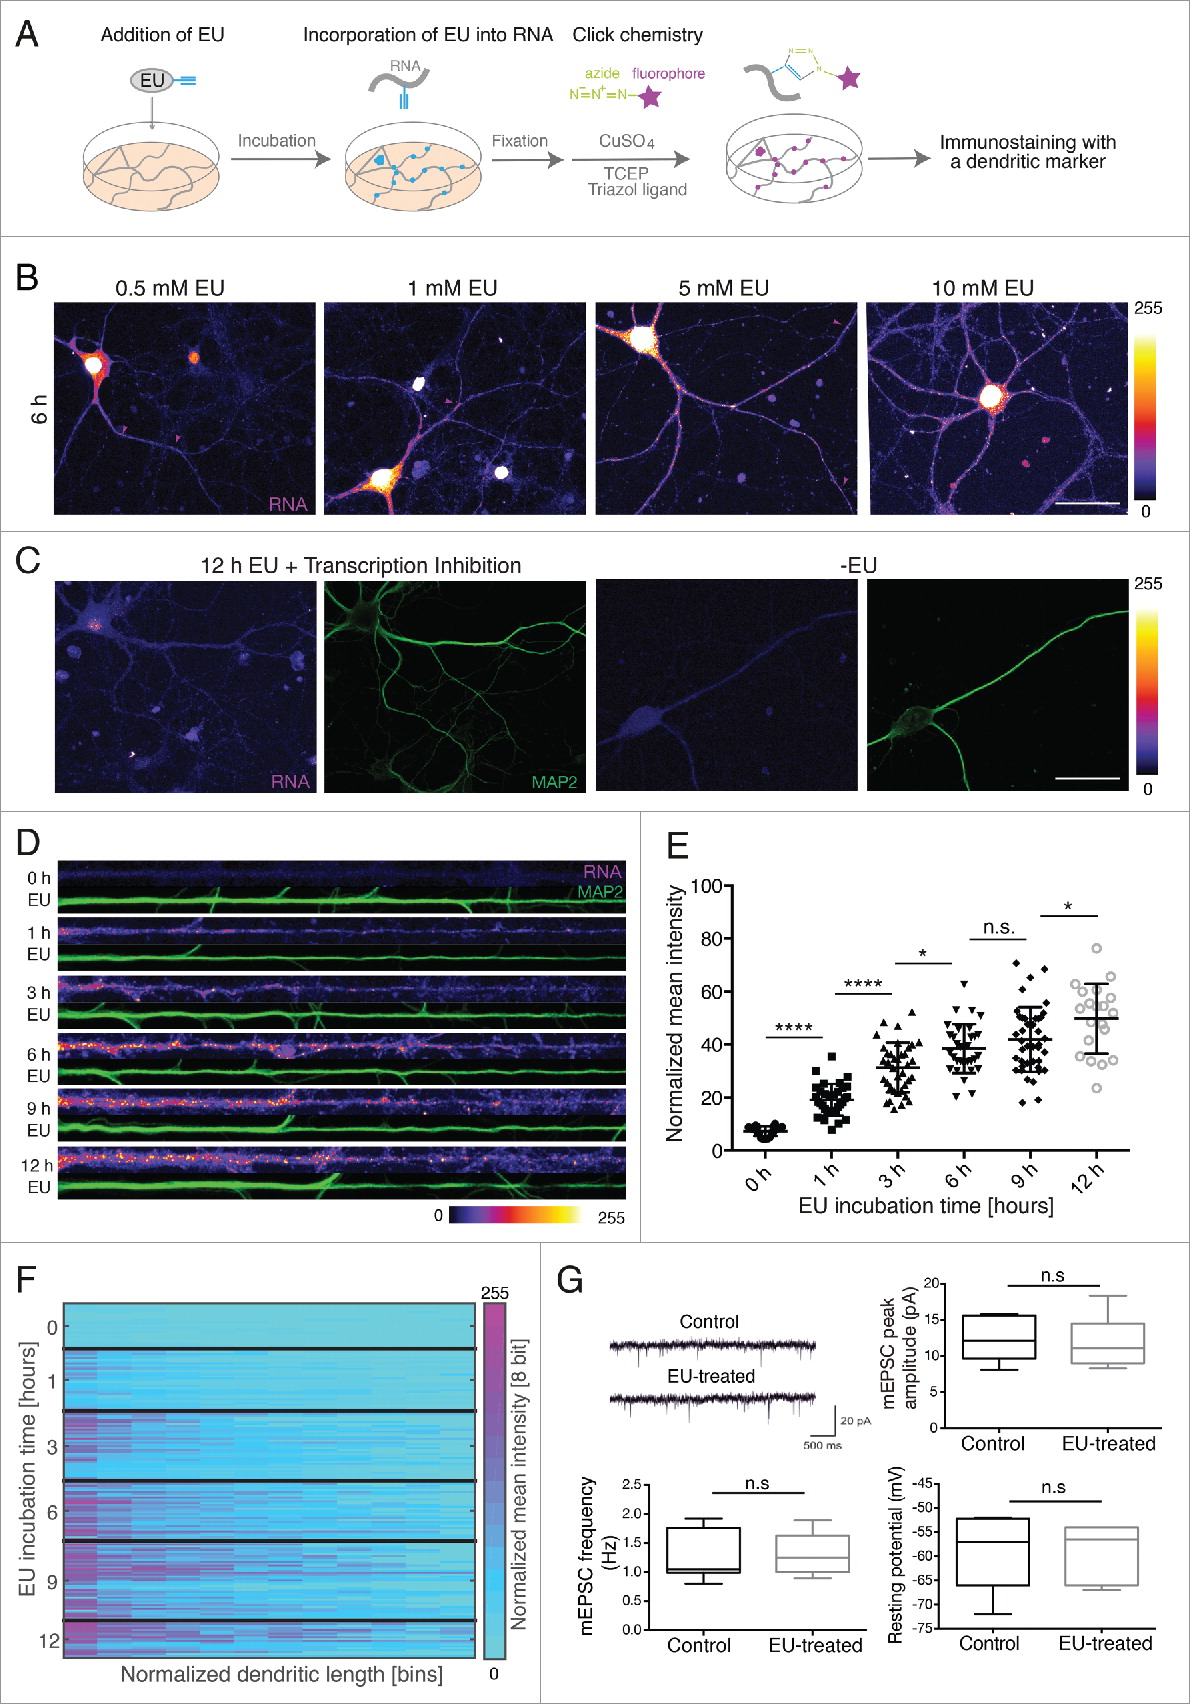
Fig. 1
Visualization of newly synthesized RNA in cultured hippocampal neurons. (A) Illustration of the method. (B) An increase in the somatic and dendritic RNA signal is observed with increasing concentrations of EU. Fire lookup table (LUT) represents fluorescence intensity of labeled RNA (pixel intensities 0–255). Arrowheads (purple) indicate RNA granules. Scale bar for B and C, 50 μm (C) Block of transcription or absence of EU results in a severely diminished nascent RNA signal. The dendrites were detected using an anti-MAP2 antibody (green). (D) Representative straightened dendrites following 5 mM EU for the indicated treatment times. Left, proximal; right, distal. Scale bar 20 μm. LUT, Fire (pixel intensities 0–255) (E) Mean intensity of the nascent RNA fluorescence in MAP2-defined dendritic area. Per time point, 20–42 dendrites from 2 independent experiments were analyzed. ****p < 0.0001, *p = 0.0254, n.s. (non significant) p = 0.6304, *p = 0.0313, respectively. (F) Heatmap shows the RNA signal along the dendrite. LUT, Spring. (G) Electrical and synaptic properties after 5 mM EU treatment for 12 h. Upper-left, representative traces of mEPSCs from the control and EU-treated neurons; upper-right, mEPSCs amplitude in control (n = 7) and EU-treated neurons (n = 7), p = 0.8844; lower-left, mEPSC frequency in control (n = 7) and EU-treated neurons (n = 7), p = 0.6342, lower-right, resting potential in control (n = 8) and EU-treated neurons (n = 8), p = 0.9707.