
|
Fig. 4
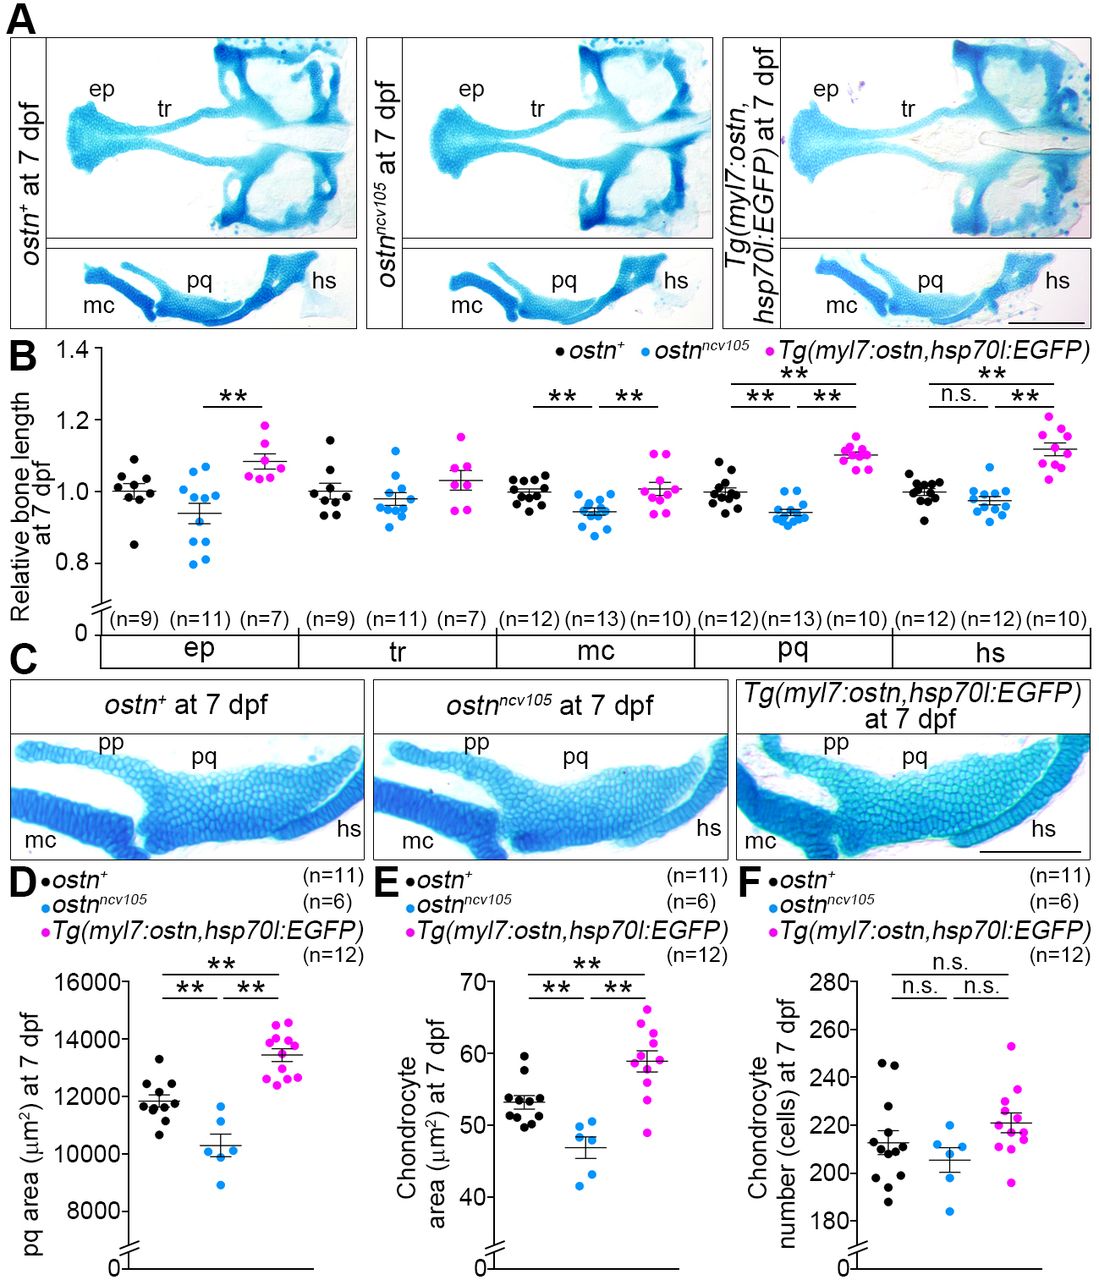
Ostn regulates the growth of endochondral bone formation. (A) Representative images of Alcian Blue staining of cranial cartilages of a wild-type (ostn+; left), ostnncv105 mutant (center) and Ostn-overexpressing [right; Tg(myl7:ostn,hsp70l:EGFP)] larva at 7 dpf. ep, ethmoid plate; tr, trabeculae; mc, Meckel's cartilage; pq, palatoquadrate; hs, hyosymplectic. (B) Quantitative analyses of A. Bone length relative to the mean length of wild-type bones is plotted. (C) Representative images of Alcian Blue staining of cartilages of the lower jaw of a wild-type, ostnncv105 mutant and Ostn-overexpressing larva at 7 dpf. pp, pterygoid process. (D) Quantitative analyses of the area of the ps of wild-type, ostnncv105 mutant and Ostn-overexpressing larvae at 7 dpf. (E) Quantitative analyses of the area of individual chondrocytes in the pq. (F) The number of chondrocytes in the pq. **P<0.01; n.s., no significant difference between two groups. Error bars indicate s.e.m. Scale bars: 200 µm in A; 100 µm in C.