
|
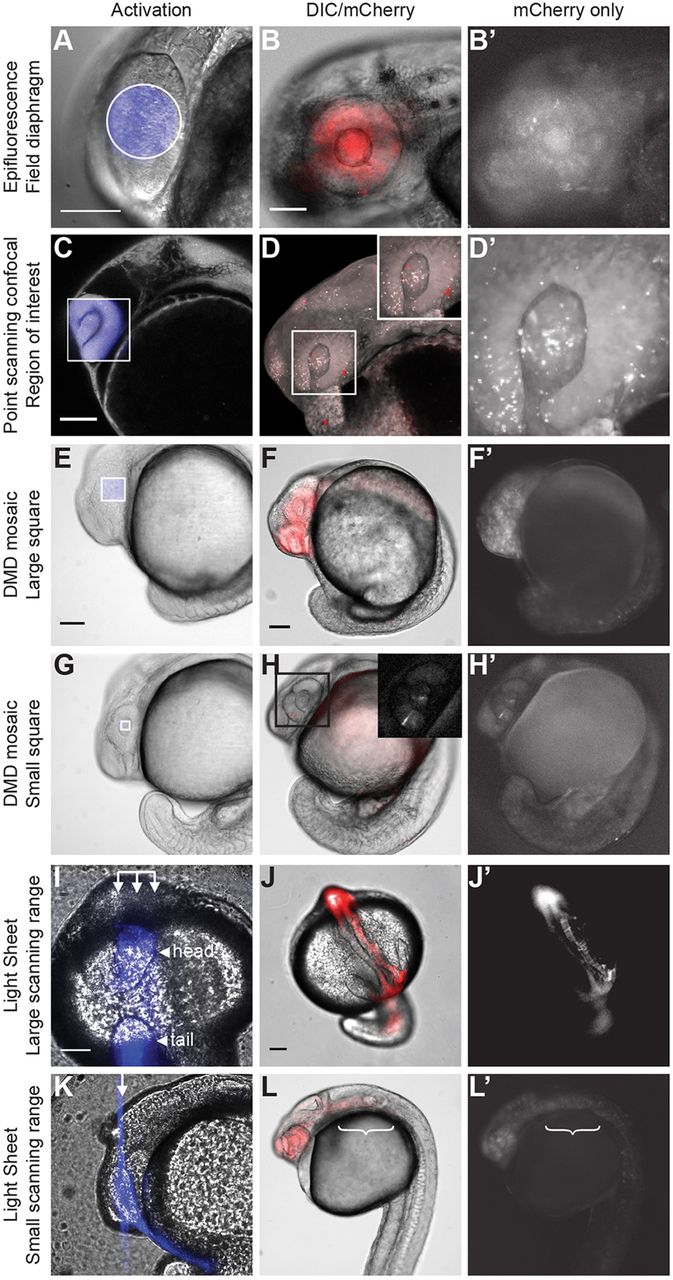
Fig. 2
Spatial control of TAEL induction achieved using four different imaging modalities. Left column shows activation region (blue) for each method. Middle and right columns show resulting mCherry expression (red) 4 h post-activation. (A,C,E,G,I,K) Bright-field and 488 nm channels merged. (B,D,F,H,J,L) Bright-field and 561 nm channels merged. (B′,D′,F′,H′,J′,L′) 561 nm channel only. Unless otherwise noted, images are lateral views with rostral to the left. (A-B′) Closing down the field diaphragm on an epifluorescence microscope (488 nm, GFP excitation setting) restricts the light coming through the objective and illuminates the sample with a small hexagonal column. (C-D′) Region of interest (ROI) on a point scanning confocal to restrict scanning of the 488 nm laser to a small square. (E-H′) Digital micromirror device (DMD) illuminated with a 470 nm LED to project variously sized square columns of blue light onto the embryo. (I-L′) Restricted scanning range of the 488 nm laser on a digital scanned laser light sheet microscope (DSLM) to project variously wide beams of blue light through the embryo. (I) En face view with head and tail as indicated. (J-J′) Dorsal view with anterior to the bottom. Brackets (L,L′) indicate an example of ‘off-target’ mCherry expression. Arrows in I and K indicate position of the light sheet. Scale bars: 100 µm.