
|
Fig. 1
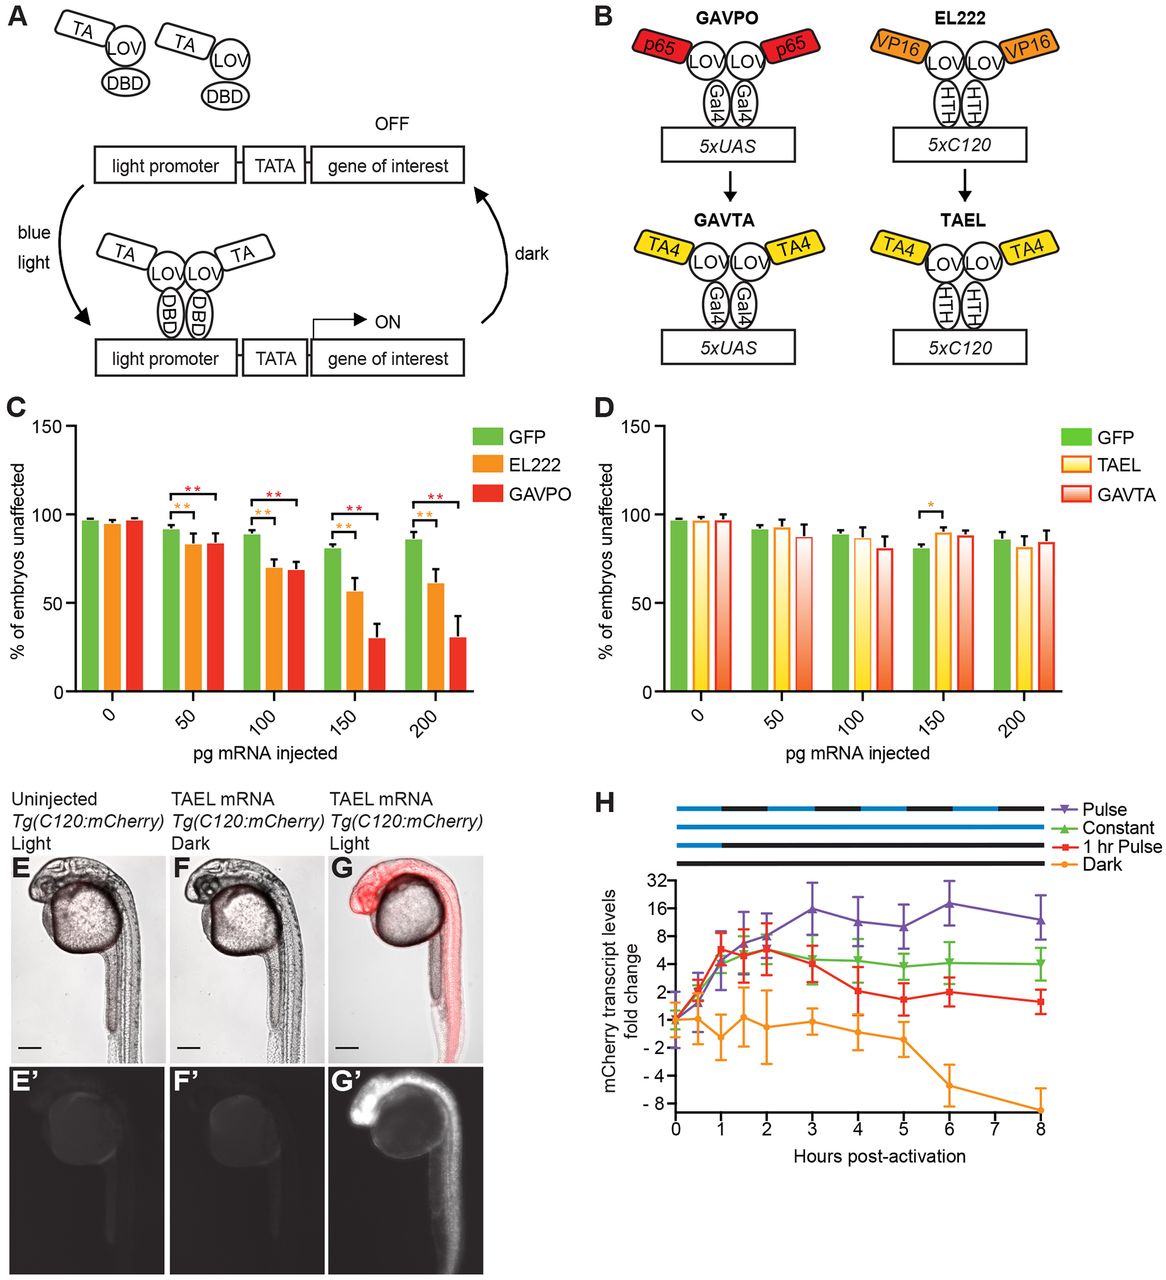
Optimization of TAEL as an optogenetic gene expression system for zebrafish. (A) Schematic depicting general mechanism for single-protein component, LOV-based, light-responsive gene expression systems. (B) Schematic depicting transcriptional activators. (C,D) Percentage of unaffected, healthy embryos per amount of mRNA injected. Injection of GAVPO or EL222 mRNA is significantly more toxic compared with the equivalent amount of GFP control mRNA (C), but GAVTA and TAEL mRNA injections produce less toxicity (D). *P<0.05, **P<0.0001, two-tailed Fisher's exact test. GFP data in D reproduced from C. Data represent mean percentage (±s.e.m.) of total embryos (n) from 2-3 independent experiments. GAVPO, n=849 embryos; EL222, n=1421 embryos; GFP, n=1190 embryos; GAVTA, n=809 embryos; TAEL, n=824 embryos. (E-G) TAEL induces robust mCherry transcription from the C120 promoter at 24 hpf (G,G′), with no visible induction of mCherry expression in dark (F,F′) or uninjected controls (E,E′). Scale bars: 200 µm. (H) qPCR analysis of TAEL-induced mCherry expression over time, normalized to 0 h post-activation for each illumination pattern. Pulsed illumination (purple line) results in stronger induction compared with constant illumination (green line). Red dotted line shows that mCherry transcription quickly turns off after activated embryos are returned to dark conditions. Embryos kept in the dark for all time points exhibit baseline mCherry expression (orange line). Data represent means±s.e.m. from three biological replicates, each with three technical replicates. Y-axis is displayed on a log2 scale.