
Fig. 6
- ID
- ZDB-IMAGE-170222-104
- Publication
- Mayrhofer et al., 2017 - A novel brain tumour model in zebrafish reveals the role of YAP activation in MAPK/PI3K induced malignant growth
- All Figures
- Figures for Mayrhofer et al., 2017
|
Fig. 6
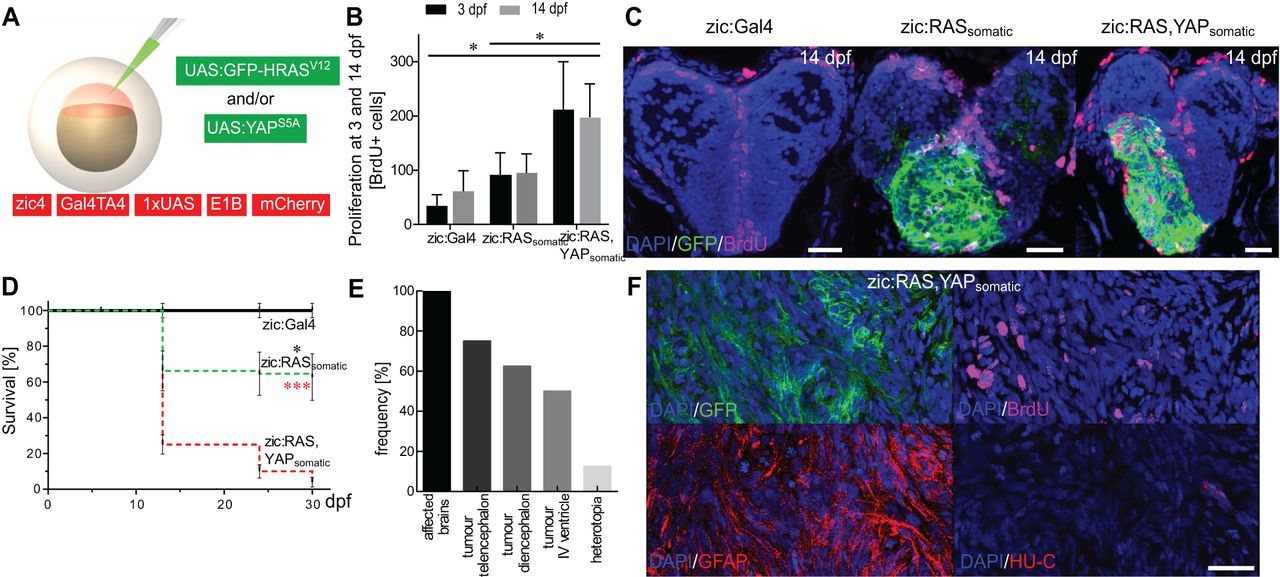
YAP activation promotes tumour growth. (A) Schematic representation of tumour induction through the co-injection of oncogenic constructs (green) into zic:Gal4 embryos. (B) Quantification of BrdU-positive cells in the telencephalon of 3 and 14 dpf juveniles reveals doubling in the number of proliferating cells in zic:RAS,YAPsomatic fish compared with zic:RASsomatic fish and zic:Gal4 control fish. (C) Confocal image of 14 dpf fish showing BrdU expression (magenta) in zic:Gal4, zic:RASsomatic and zic:RAS,YAPsomatic. (D) Survival rate of zic:RASsomatic (green dashed line; n=166) compared with zic:Gal4 (black solid line, black asterisk; n=105) and zic:RAS,YAPsomatic (red dashed line, red asterisks; n=100). (E) Graph representing the frequency of different lesions resulting from zic:RAS,YAPsomatic expression as determined by stereomicroscopic analysis with tumours in telencephalon (T), diencephalon (D) and IVth ventricle (V), and heterotopia (H). (F) Immunostaining for GFP, BrdU, GFAP and HU-C of zic:RAS,YAPsomatic fish. Data are represented as mean±s.d. *P<0.05; ***P<0.001. Scale bars: 20 µm in C,F.