
Fig. 5
- ID
- ZDB-IMAGE-170210-5
- Genes
- Publication
- Wang et al., 2016 - The somite-secreted factor Maeg promotes zebrafish embryonic angiogenesis
- All Figures
- Figures for Wang et al., 2016
|
Fig. 5
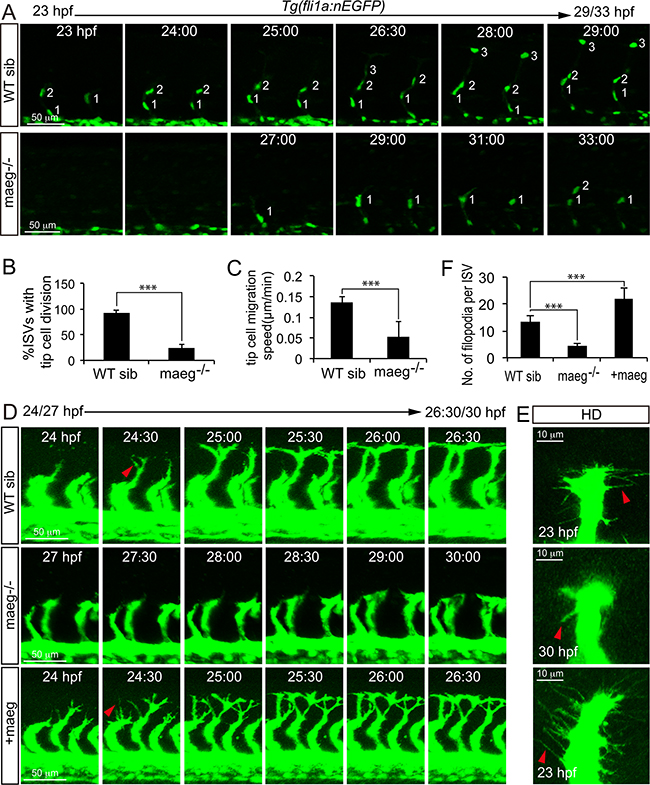
Maeg regulates ISV tip cell behaviors. A. Still images from in vivo time-lapse imaging analysis of WT and maeg−/−Tg(fli1a:nEGFP) embryos. Time (hpf) is noted in the top. Nuclei of ISVs are numbered. B. Percentage of ISVs with tip cell division in control embryos and maeg−/− embryos. Student’s t-test; ***,P<0.001. C. Migration speed of ISV tip cells. Mann Whitney U-test; ***,P<0.001. D. Still images from in vivo time-lapse imaging analysis of ISV tip cell filopodia in Tg(kdrl:EGFP) embryos. Time (hpf) is noted in the bottom. Red arrowheads indicate filopodia extensions. E. Confocal imaging analysis of ISV tip cell filopodia in Tg(kdrl:EGFP) embryos with HD detection setting. Red arrowheads indicate filopodia extensions. F. ISV tip cell filopodia number in per ISVs. One-Way ANOVA; ***, P<0.001.