
Image
|
Figure Caption
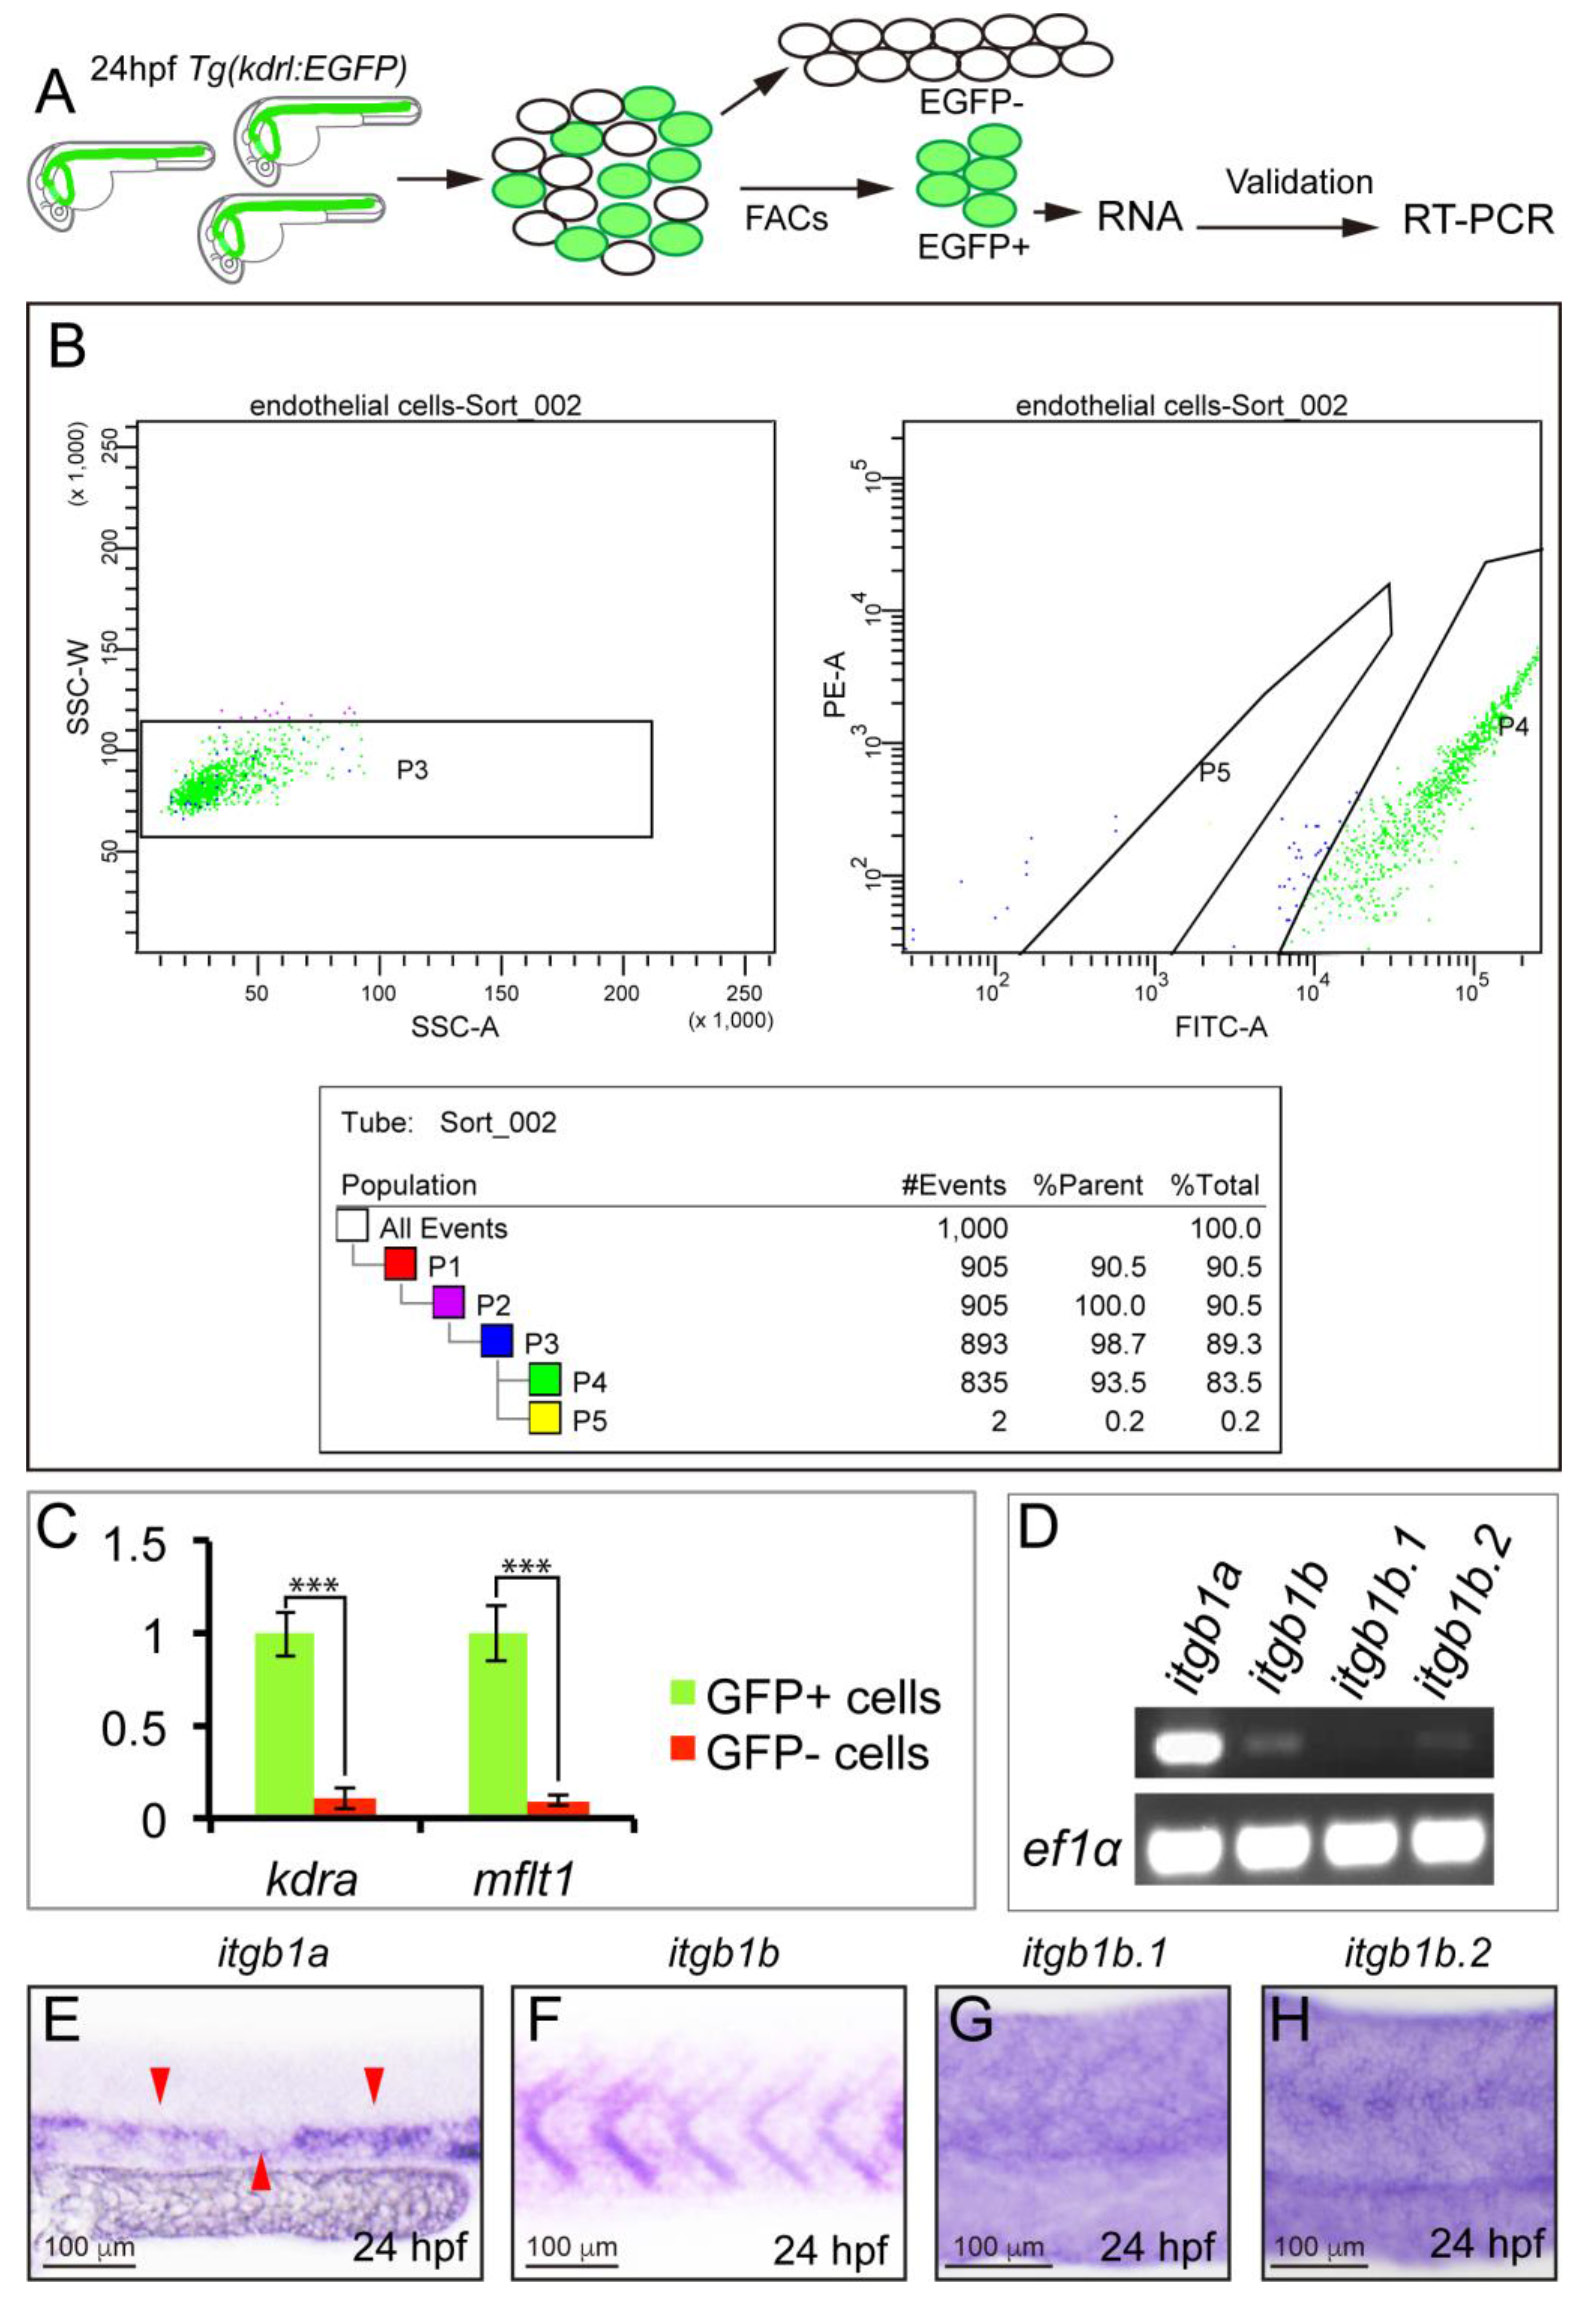
Fig. S7
Identification of itgb1 isoform highly enriched in zebrafish ECs. A. Diagram of the experimental procedure. B. Diagnostic FACS analysis of the sorted cells. P4 is the GFP positive cells; P5 is GFP negative cells. C. Quantitative PCR analysis of kdra and mflt1 gene expression between GFP positive cells and GFP negative cells after FACs sorting. D. RT-PCR analysis of expression of itgb1a, itgb1b, itgb1b.1 and itgb1b.2. E-H. Whole mount in situ analysis of itgb1a, itgb1b, itgb1b.1 and itgb1b.2 at 24 hpf.
Acknowledgments
This image is the copyrighted work of the attributed author or publisher, and
ZFIN has permission only to display this image to its users.
Additional permissions should be obtained from the applicable author or publisher of the image.
Full text @ Oncotarget