
|
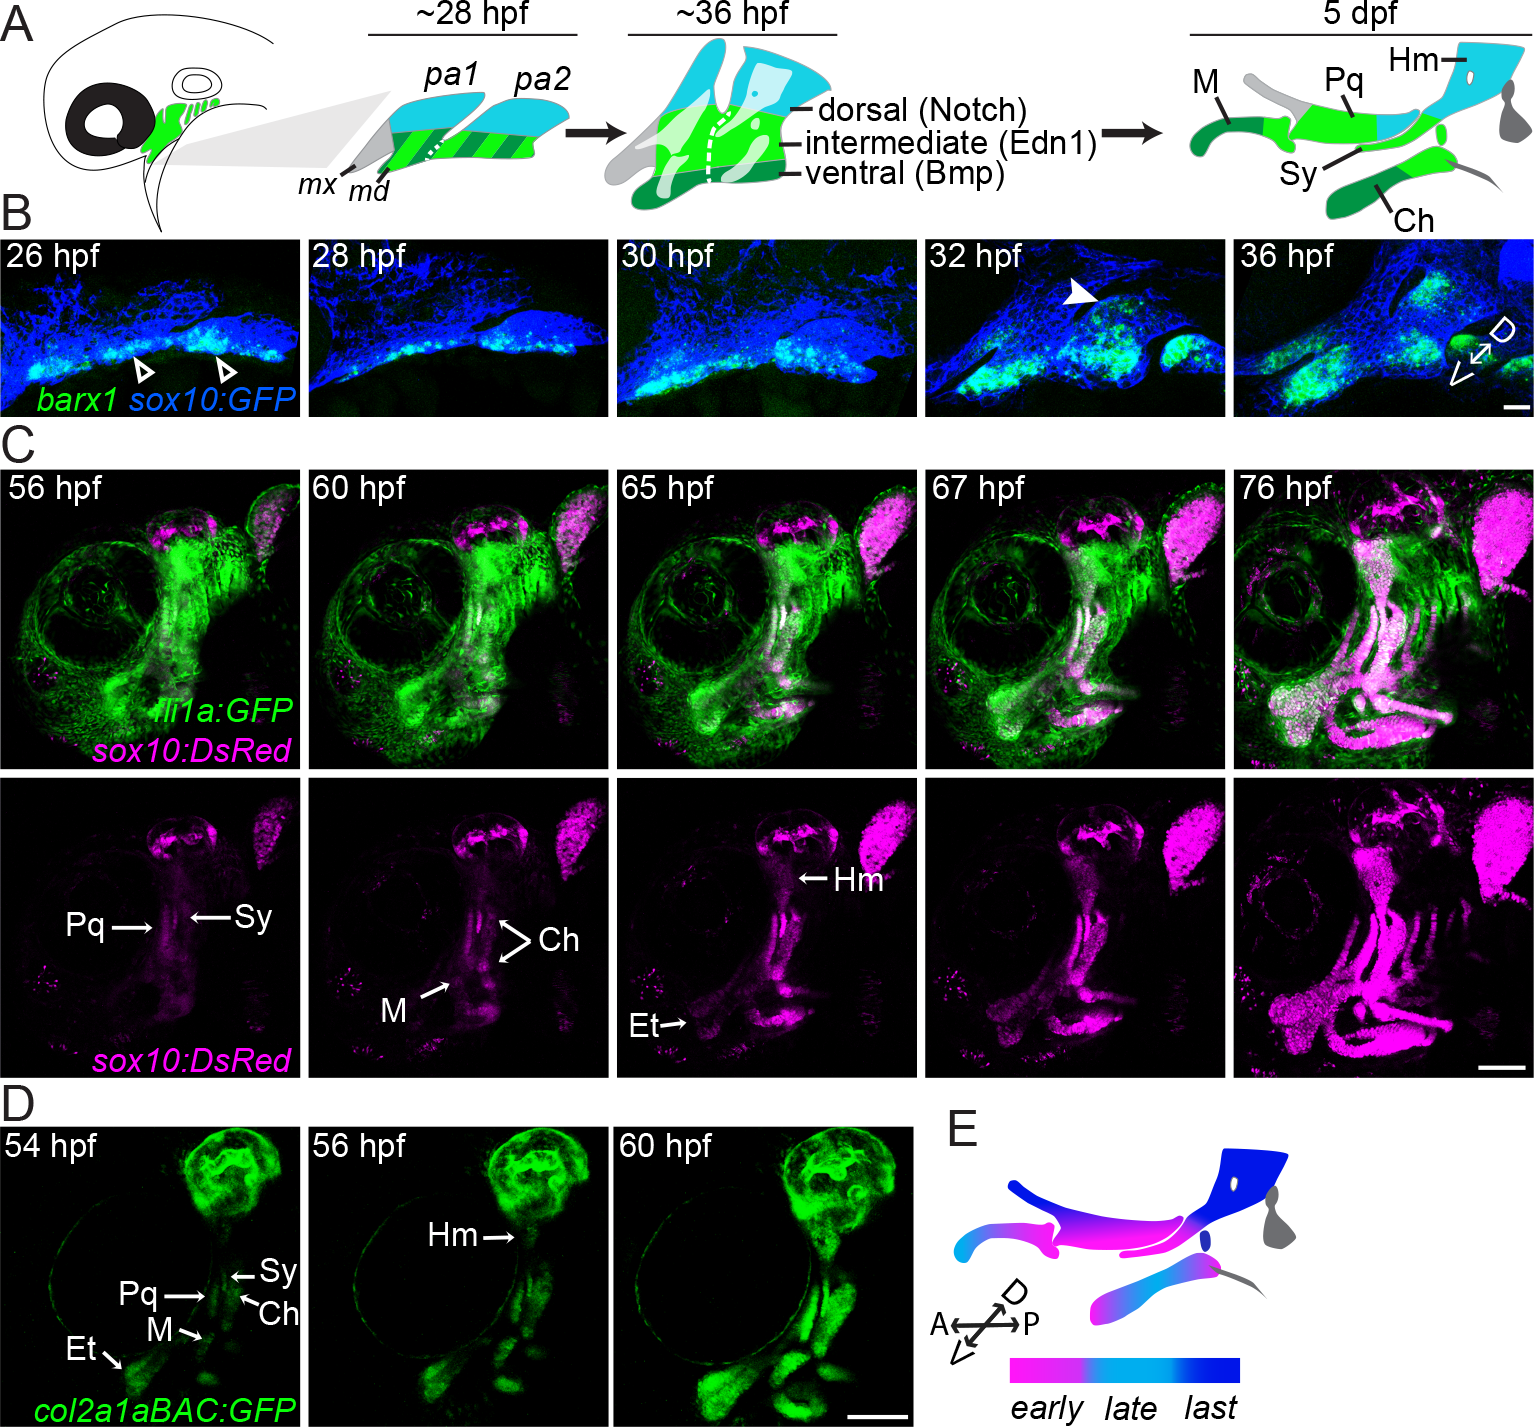
Fig. 2
Accelerated cartilage differentiation in ventral-intermediate arch NCCs.
(A) Schematic of pharyngeal arch patterning in zebrafish. At early patterning stages (~28 hpf), the first two pharyngeal arches (pa1, pa2) are divided into distinct dorsal (blue) and ventral/intermediate (green stripe) domains, with the latter resolving into intermediate (light green) and ventral (dark green) domains by 36 hpf. Notch activity governs the dorsal domain, Edn1 the intermediate domain, and Bmp signaling the ventral domain. The anterior maxillary domain (grey) is not significantly influenced by any of these pathways. The facial cartilages of the larval skeleton (5 dpf) are color-coded based on their arch origins. Hm, hyomandibula; Pq, palatoquadrate; M, Meckel’s; Sy, symplectic; Ch, ceratohyal. (B) barx1 (green) is upregulated ventrally (≤ 26 hpf, white open arrowhead) well before dorsal second arch expression can be detected (~32 hpf, white arrowhead). NCCs express the sox10:GFP transgene (blue). Shown are maximum intensity projections of confocal z-stacks of single-color in situs co-stained with a GFP antibody. The orientation of the dorsal (D)-ventral (V) axis is indicated. (C) Stills from a time-lapse movie (see S1 Movie) show the emergence of facial cartilages (sox10:DsRed+, magenta) from fli1a:EGFP+ ectomesenchyme (green). sox10:DsRed+ chondrocytes appear in a stereotyped sequence within the facial cartilages, with cells of the intermediate Sy and Pq cartilages detectable first at 56 hpf, followed by the ventral M and Ch cartilages at 60 hpf and the dorsal Hm at 65 hpf. (D) The same sequence of cartilage differentiation is seen slightly earlier in stills from a time-lapse movie of col2a1aBAC:GFP fish (see S2 Movie). The time-lapses in B and C were performed with a 20x objective using 0.5x digital magnification. Et, ethmoid cartilage. (E) Color-coded schematic of the sequence of chondrocyte differentiation in the facial skeleton. The orientations of the D-V and anterior (A)-posterior (P) axes are indicated. Scale bar in B = 20 μm; scale bars in C, D = 100 μm.