
|
Fig. 1
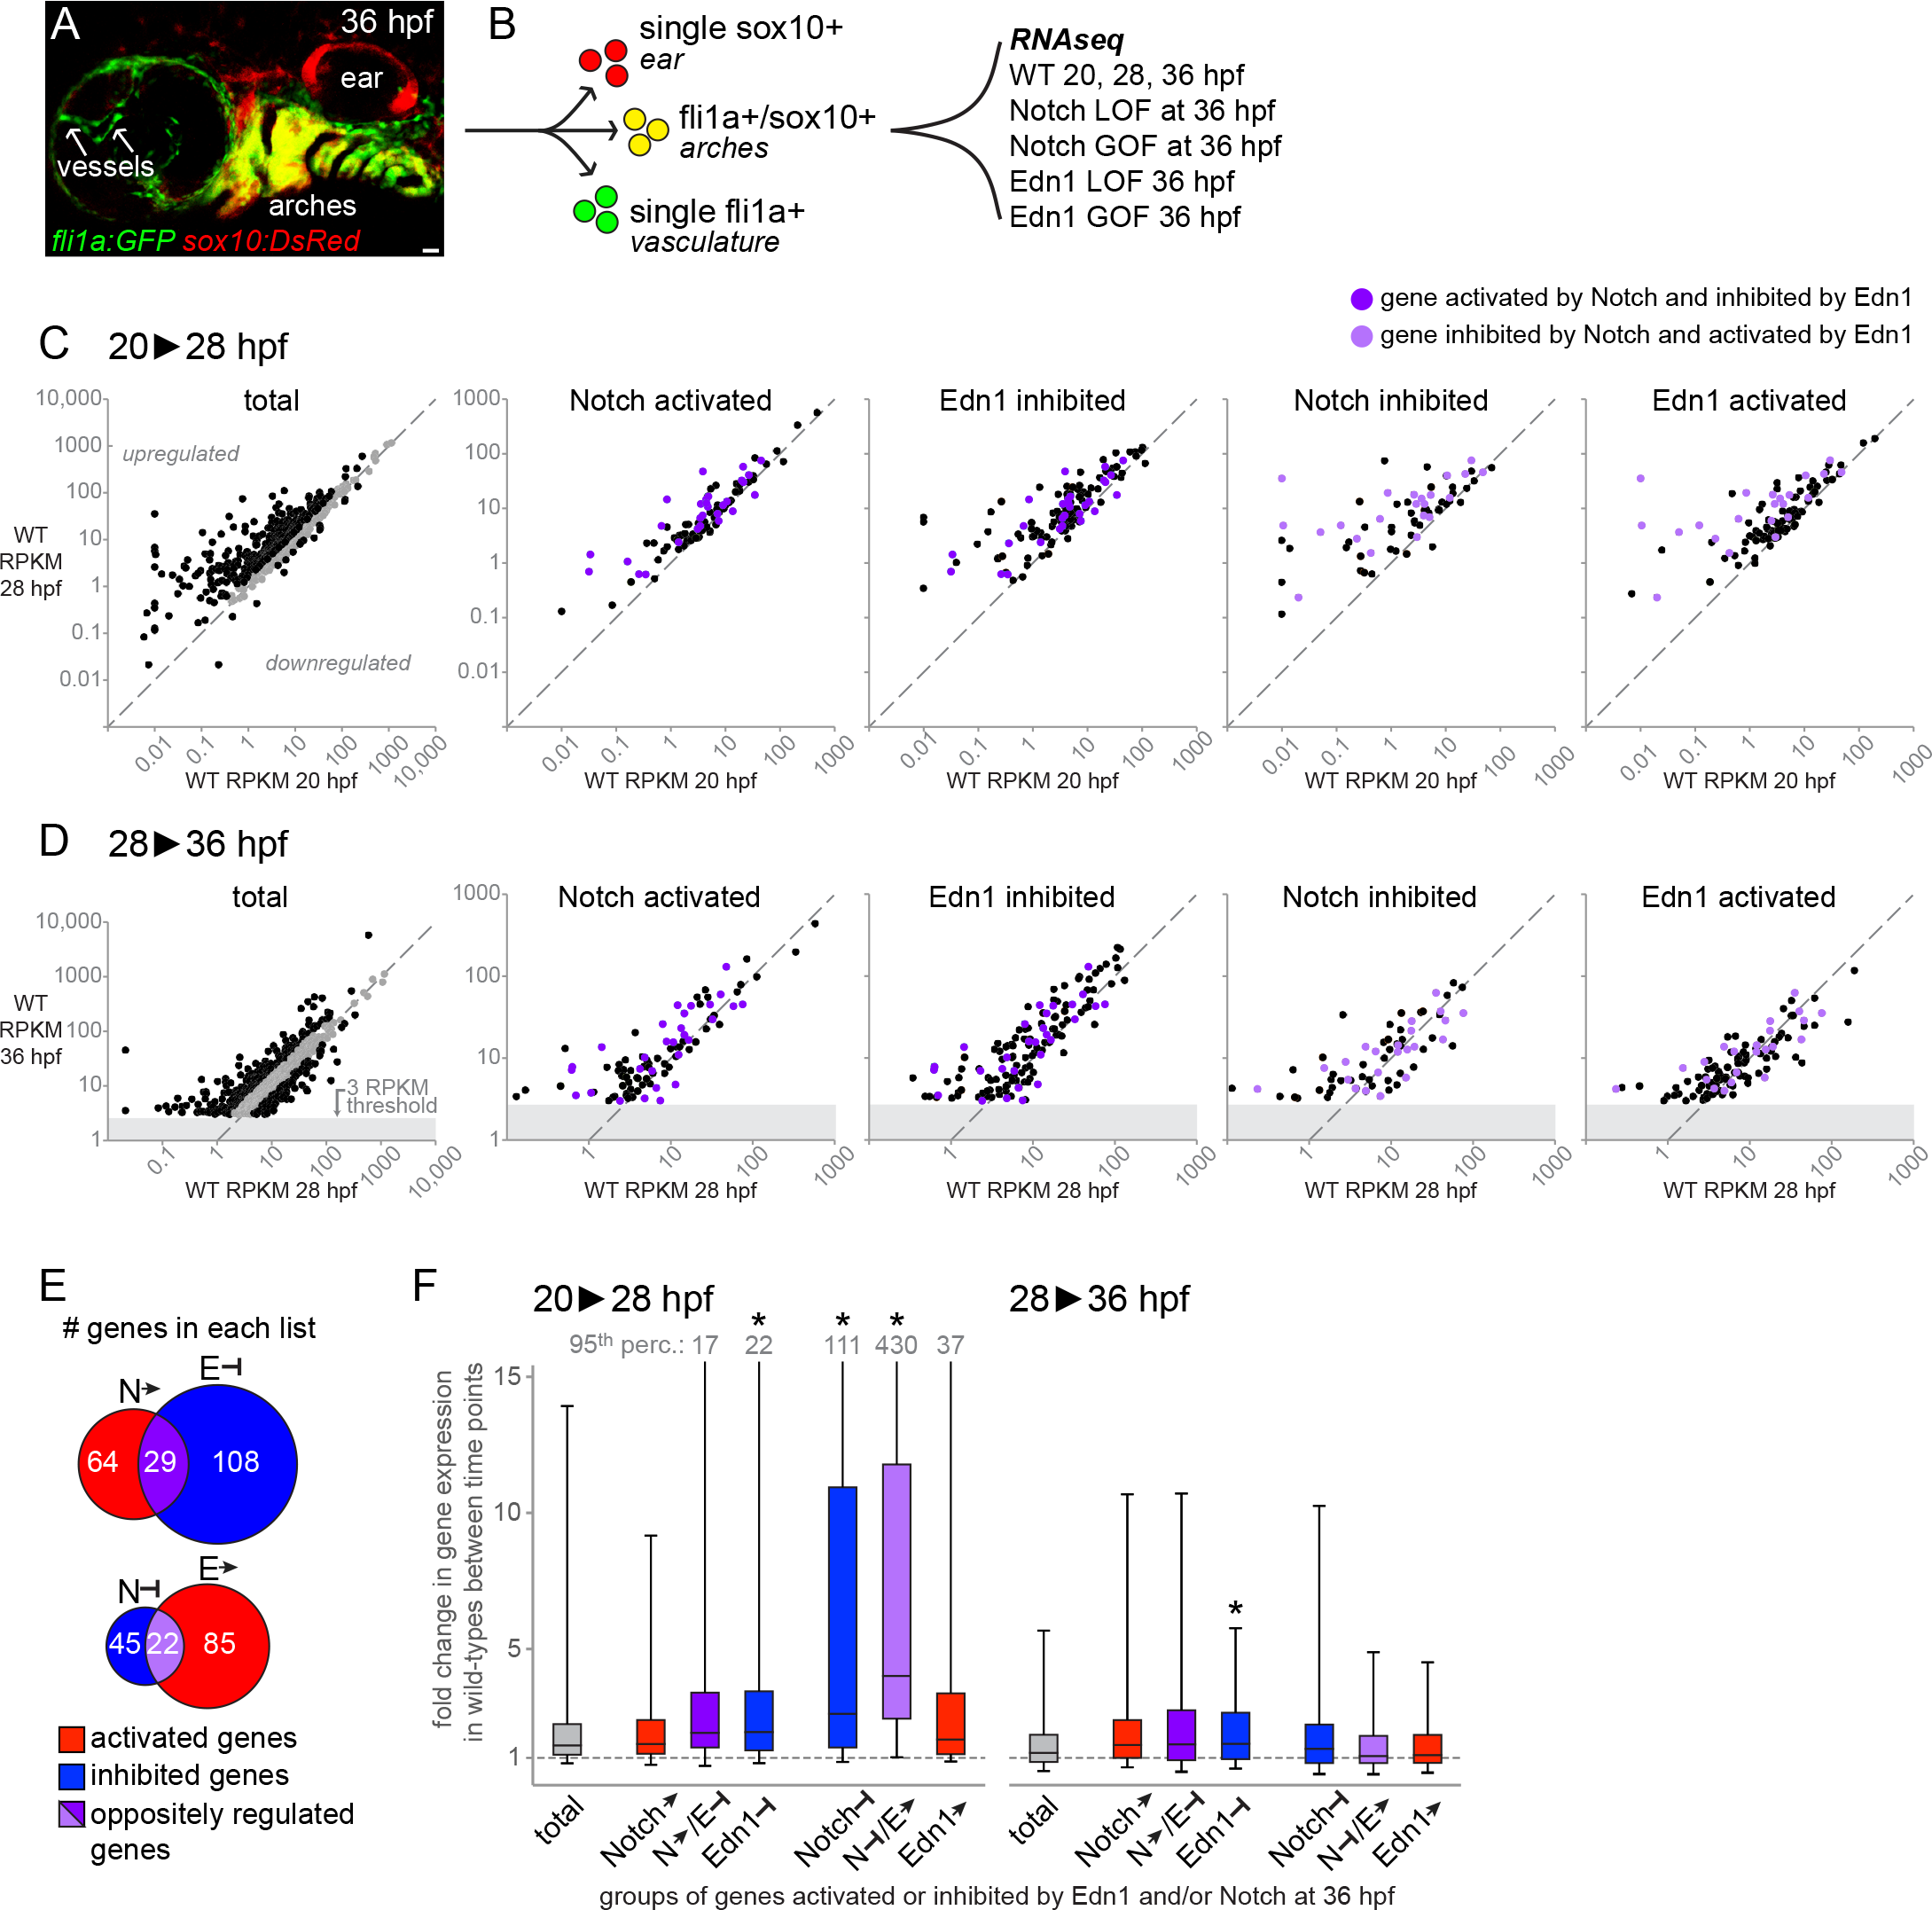
Jagged-Notch signaling represses genes strongly induced during pharyngeal arch differentiation.
(A) 36 hpf fli1a:EGFP; sox10:DsRed embryo showing colocalization of GFP and DsRed in the arches (yellow), with DsRed-only cells (red) in the ear and GFP-only cells (green) in the vasculature (and macrophages). Scale bar = 20 μm. (B) Double-positive embryos were dissociated and subjected to FACS to isolate GFP/DsRed+ arch cells (yellow) for RNA sequencing. Wild-type embryos were profiled at three stages, and Notch and Edn1 loss- and gain-of-function (LOF, GOF) models at 36 hpf only. (C-D) Scatterplots depicting changes in expression (RPKM) among the genes on each list from 20 to 28 hpf (C) and 28 to 36 hpf (D). Genes to the left of the diagonal were upregulated, while genes to the right were downregulated. For the ‘total’ arch NCC-enriched gene charts, black points indicate genes with fold-changes ≥ 1.5, and grey points indicate genes with fold changes ≤ 1.5. In the other charts, black points correspond to genes uniquely present on a given list, whereas purple points indicate genes oppositely regulated by Notch and Edn1 (dark purple: Notch-activated/Edn1-inhibited; light purple: Notch-inhibited/Edn1-activated). The grey blocks in D reflect the filtering threshold (RPKM ≥ 3 at 36 hpf in wild types) used to generate the total list of arch NCC-enriched genes. (E) Venn diagrams display the numbers of genes on each list, with genes shared between the Notch-activated/Edn1-inhibited or Notch-inhibited/Edn1-activated lists indicated in dark and light purple, respectively. (F) Summary of gene expression changes (RPKM) in wild types between 20 and 28 hpf (left chart) and 28 and 36 hpf (right chart), for genes classified as activated (red) or inhibited (blue) by Notch or Edn1 signaling. The data are shown as the median fold-change value for all genes on a given list (black central line), with flanking second and third quartiles as the lower and upper boxes, respectively, and the 5th and 95th percentiles indicated by the whiskers. For the lists in which the 95th percentile value exceeded the upper boundary of the chart, the value is indicated at the top of the upper whisker. Compared with the total list of arch NCC-enriched genes, genes inhibited by Notch signaling and those that were both inhibited by Notch and activated by Edn1 (light purple) showed a significantly larger increase in expression from 20 to 28 hpf (p < 0.001). Genes inhibited by Edn1 also increased slightly but significantly from 20–28 and 28–36 hpf relative to the total list. The gray dashed line indicates a fold-change value of 1 (no change in expression) between the two time points.