
|
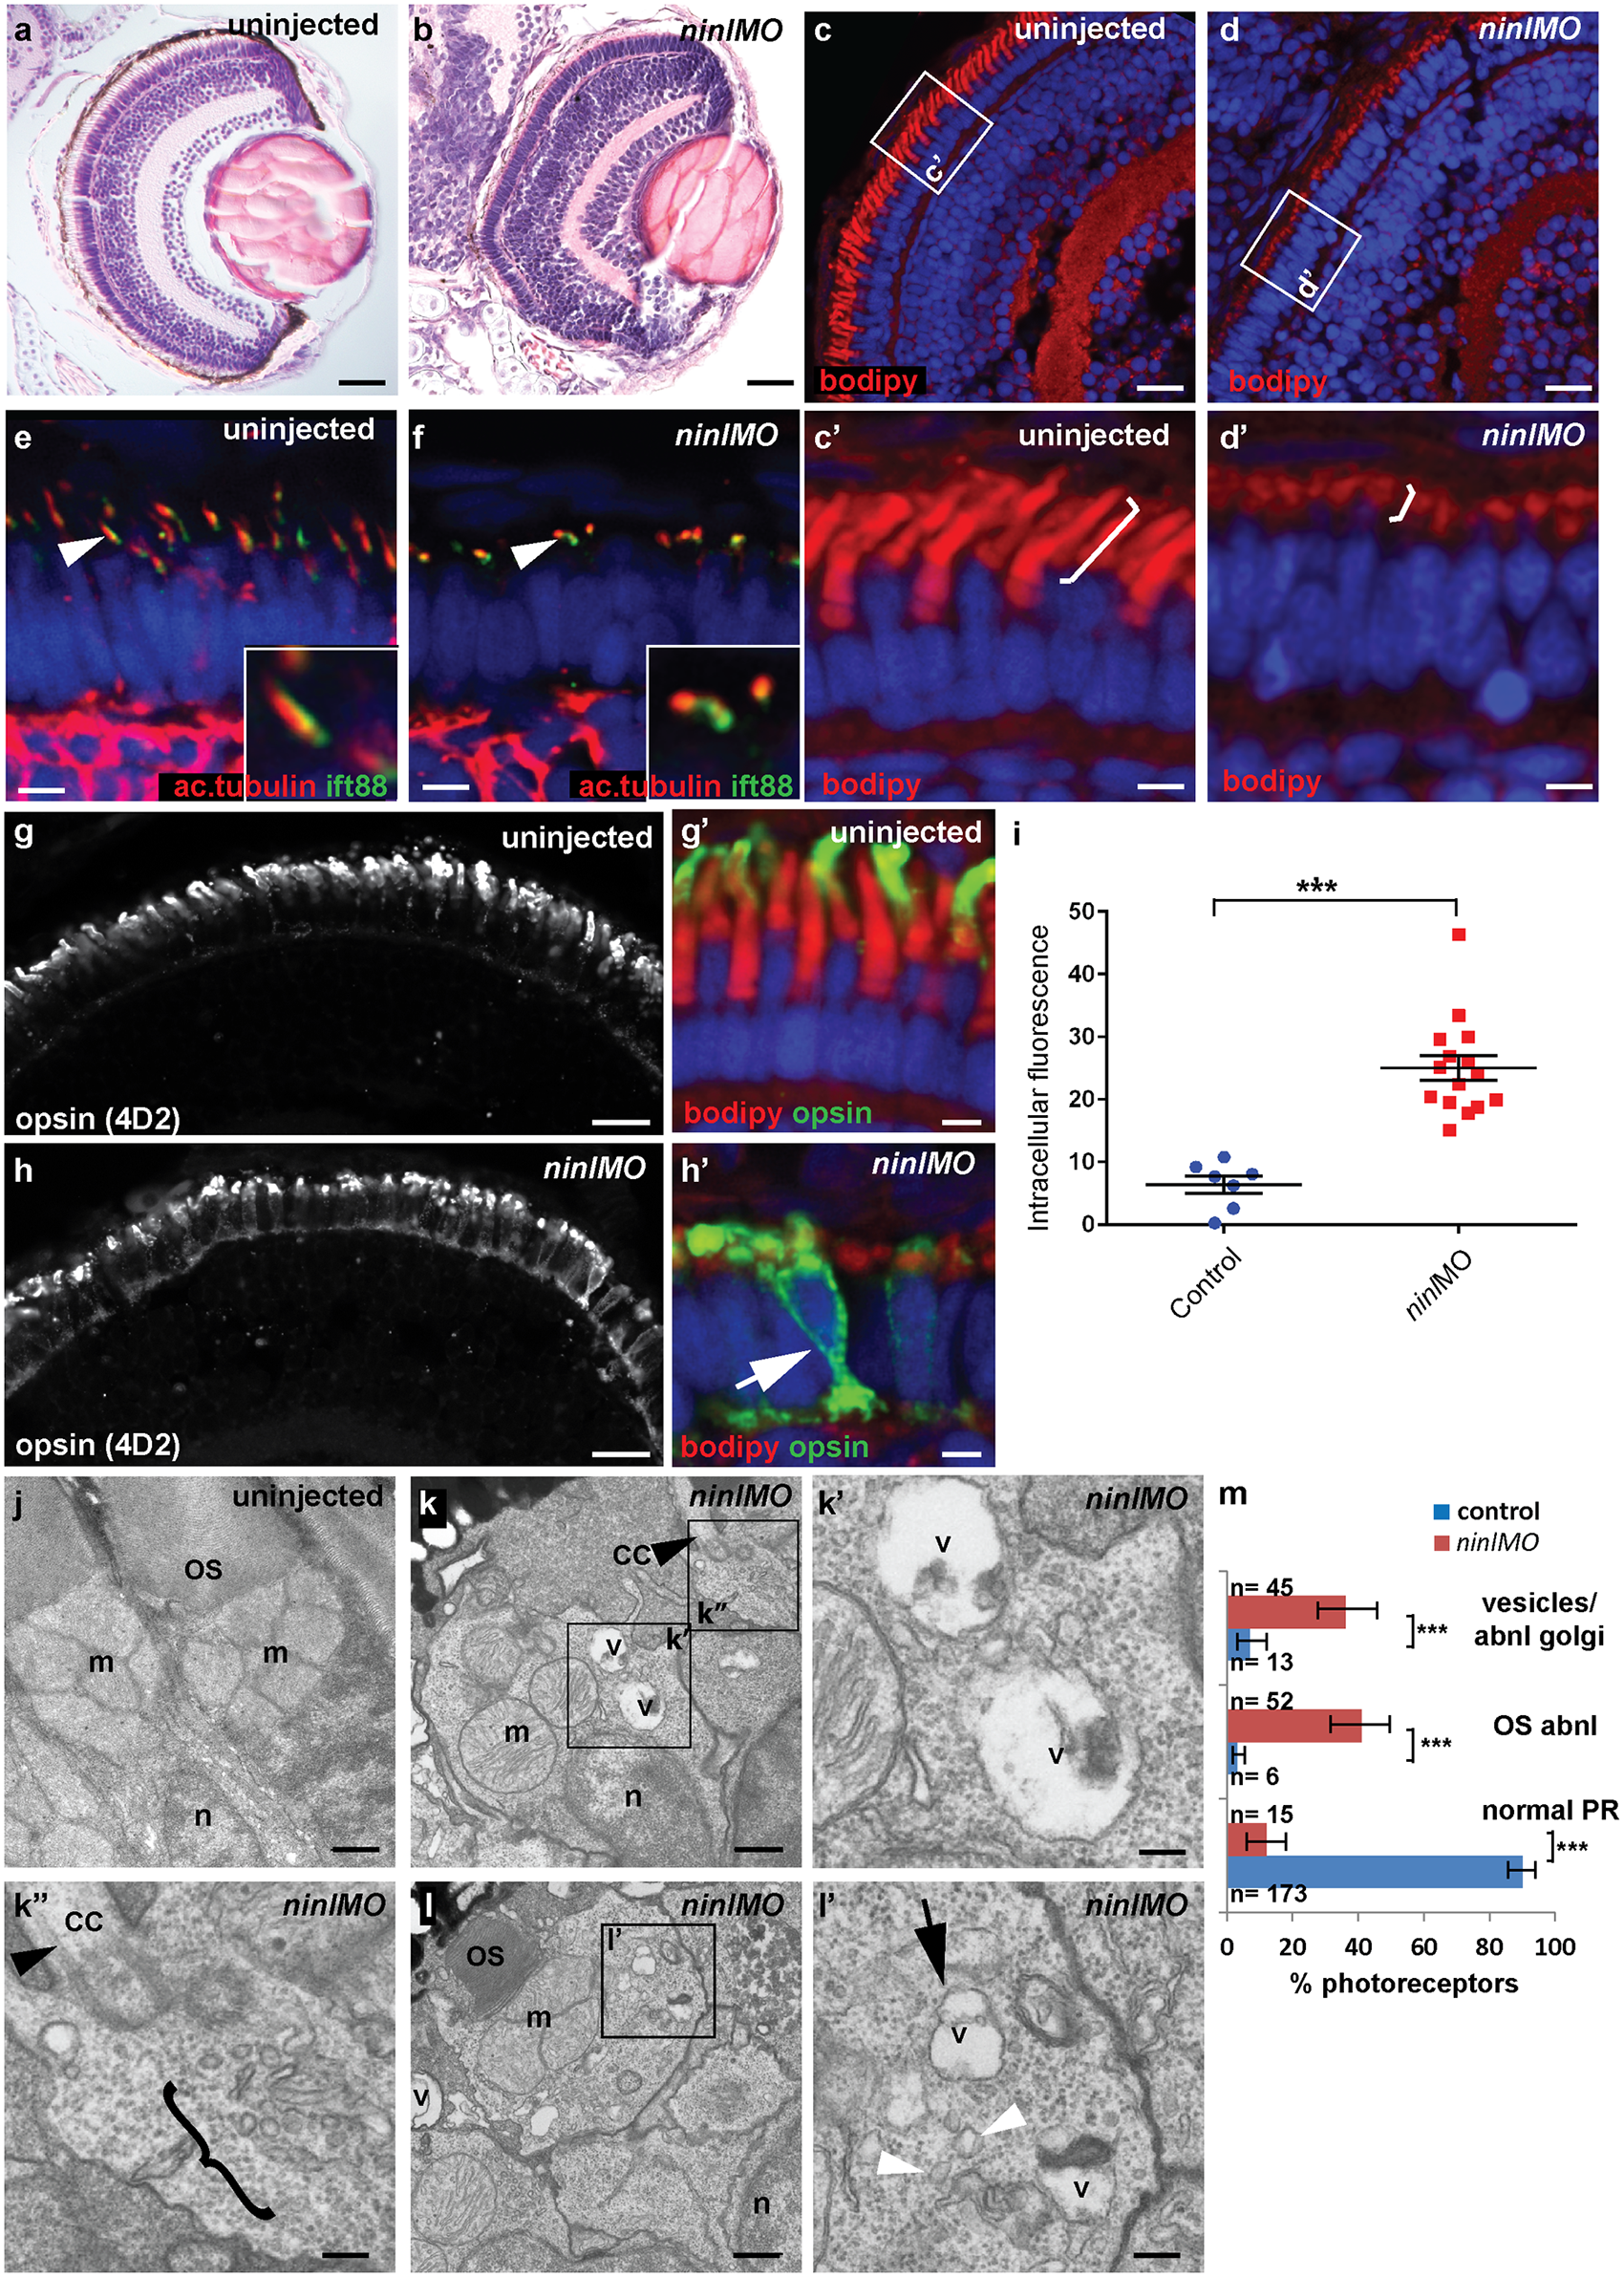
Fig. 3
Zebrafish ninl knockdown causes loss of axonemes and outer segments, opsin mislocalization and vesicle/vacuole accumulation.
(a-b) Paraffin sections stained with Hematoxylin/Eosin of control (a) and ninl knockdown larvae (b) demonstrating shortened outer segments and grossly preserved retinal lamination in the morphants. (c-d') Bodipy-stained cryosections highlight the shortened (brackets c'-d') and dysmorphic outer segments of ninl knockdown larvae (d and d') compared to the long cone- or rod-shaped outer segments of controls (c and c'). (e-f) Axonemes and connecting cilia marked with anti-acetylated alpha-tubulin and anti-Ift88 antibodies are severely shortened and reduced in numbers in ninl knockdown larvae (arrowhead in f). (g-h') Immunofluorescence with anti-opsin antibody 4D2 demonstrates mislocalization of opsins within the cell body in ninl knockdown larvae (arrow in h') compared to controls (g) where opsins are restricted to the outer segment. (i) Quantification of the intracellular opsin accumulation in ninl morphant photoreceptors compared to control: each single datapoint in the scatter graph displays the averaged mean grey value from one larva. The mean value and the Standard Error of the Mean (SEM) are displayed as bars. The difference is statistically significant (*** = p<0.0001, Student's t-test). (j-l') Transmission electron microscopy of control (j) and ninl knockdown larvae (k-l') demonstrates absent or shortened and dysmorphic outer segments (OS) and accumulation of large vacuoles (v, arrow in l') and smaller vesicular structures (bracket in k” and white arrowheads in l') in morphants. Black arrowheads point to the connecting cilium in k and k”. k' and k” are the boxed areas in k and l' is the boxed area in l. (m) Quantification of the % of photoreceptors displaying these phenotypes. Absolute numbers of photoreceptors are also indicated. Error bars indicate 95% Confidence Intervals. The differences between morphant (red bars) and controls (blue bars) are statistically significant (*** = p<0.0001, Fisher's exact test). Larvae in all panels are 4 dpf old. Scale bars are 30 μm in a-b, 15 μm in c-d and g-h, 3 μm in c'-d' and g'-h', 4 μm in e-f, 0.5 μm in j-k and l and 150nm in k'-k” and l'. OS outer segment, CC connecting cilium, m mitochondria, n nucleus, v vacuole.