
|
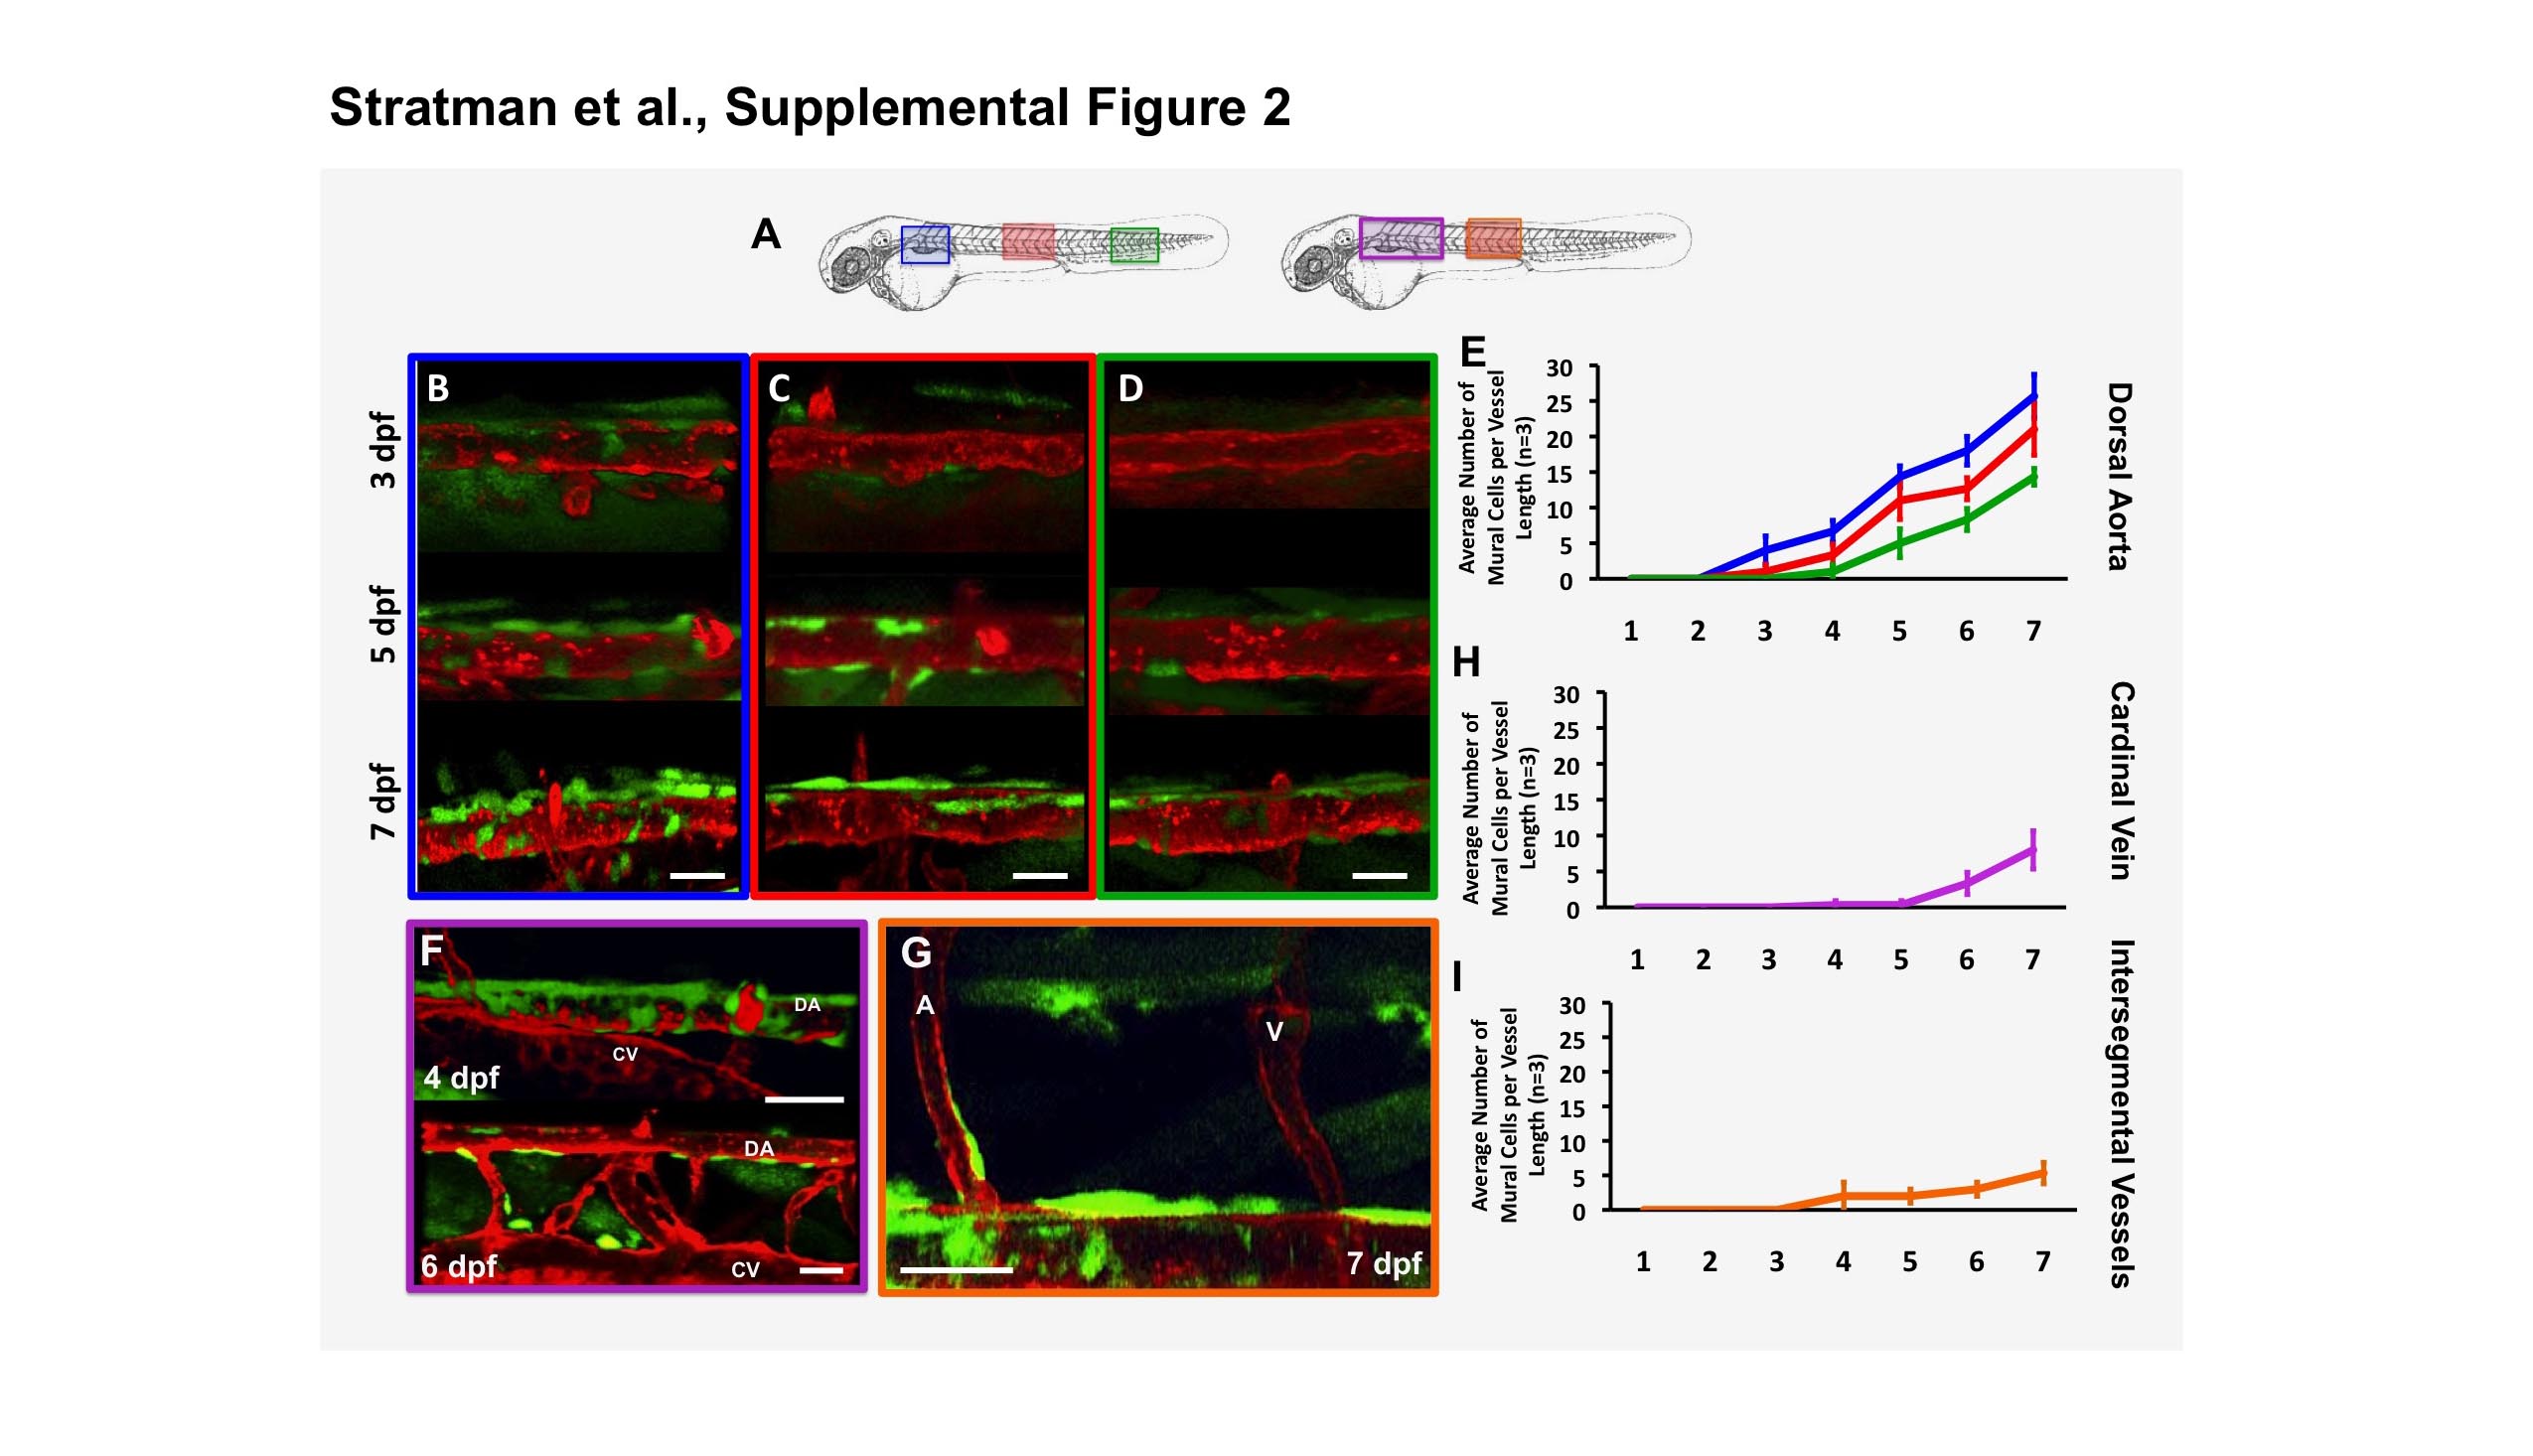
Fig. S2
Time-course analysis and quantification of mural cell accumulation in different vascular beds. (A) Schematic representation of areas assessed for mural cell accumulation over time in the developing zebrafish. (B-E) Representative images of mural cell association with the dorsal aorta in sections proximal to the head (B, blue boxes and lines), mid-trunk (C, red boxes and lines), and in the tail region (D, green boxes and lines) at 3, 5 and 7 dpf. (E) Quantification of the number of mural cells associated with a four-somite length of dorsal aorta over time. Blue line is the quantification from the most proximal section to the head, red line is the quantification from mid-trunk section and the green line is quantification from the more distal tail region. (F,H) Representative images of mural cells associated with the cardinal vein at 4 and 6 dpf (F, purple boxes and lines), and quantification of the number of mural cells associated with a four-somite length of cardinal vein over time (H). (G,I) Representative image of mural cells associated with the intersegmental arteries at 7 dpf (G, orange boxes and lines), and quantification of the number of mural cells associated with a four-ISV length of the zebrafish trunk over time (I). Scale bars = 50 μm. Mean ± s.e.m. n=5 fish per region.