
IMAGE
Fig. 4
- ID
- ZDB-IMAGE-170202-9
- Publication
- Lee et al., 2016 - Genetic inhibition of autophagy promotes p53 loss-of-heterozygosity and tumorigenesis
- All Figures
- Figures for Lee et al., 2016
Image
|
Figure Caption
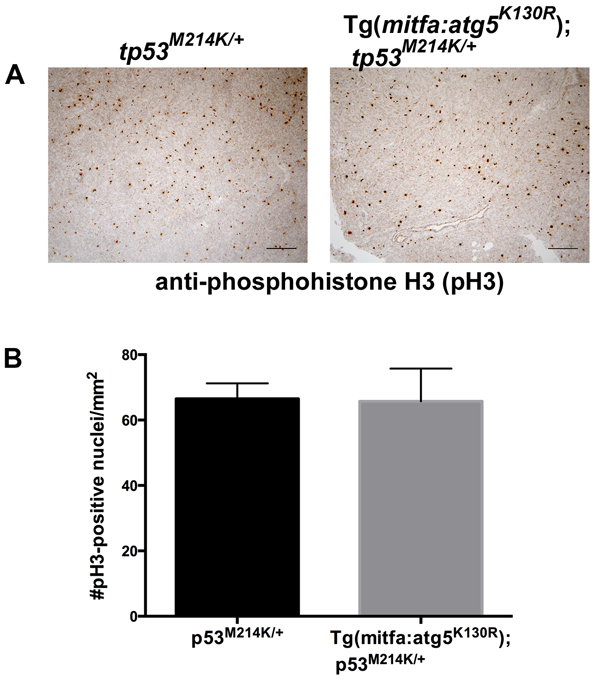
Fig. 4
Cell proliferation rates are equivalent in MPNSTs from atg5K130R transgenic and non-transgenic p53-deficient fish. A. Anti-phosphohistone H3 immunohistochemistry of tp53M214K/+ and Tg(mitfa:atg5K130R); tp53M214K/+ fish. B. Quantification of staining. Mean +/- SEM of 5 tumors per genotype is shown.
Acknowledgments
This image is the copyrighted work of the attributed author or publisher, and
ZFIN has permission only to display this image to its users.
Additional permissions should be obtained from the applicable author or publisher of the image.
Full text @ Oncotarget