
Fig. S5
- ID
- ZDB-IMAGE-170201-6
- Genes
- Publication
- Liu et al., 2016 - The Machado-Joseph Disease Deubiquitinase Ataxin-3 Regulates the Stability and Apoptotic Function of p53
- All Figures
- Figures for Liu et al., 2016
|
Fig. S5
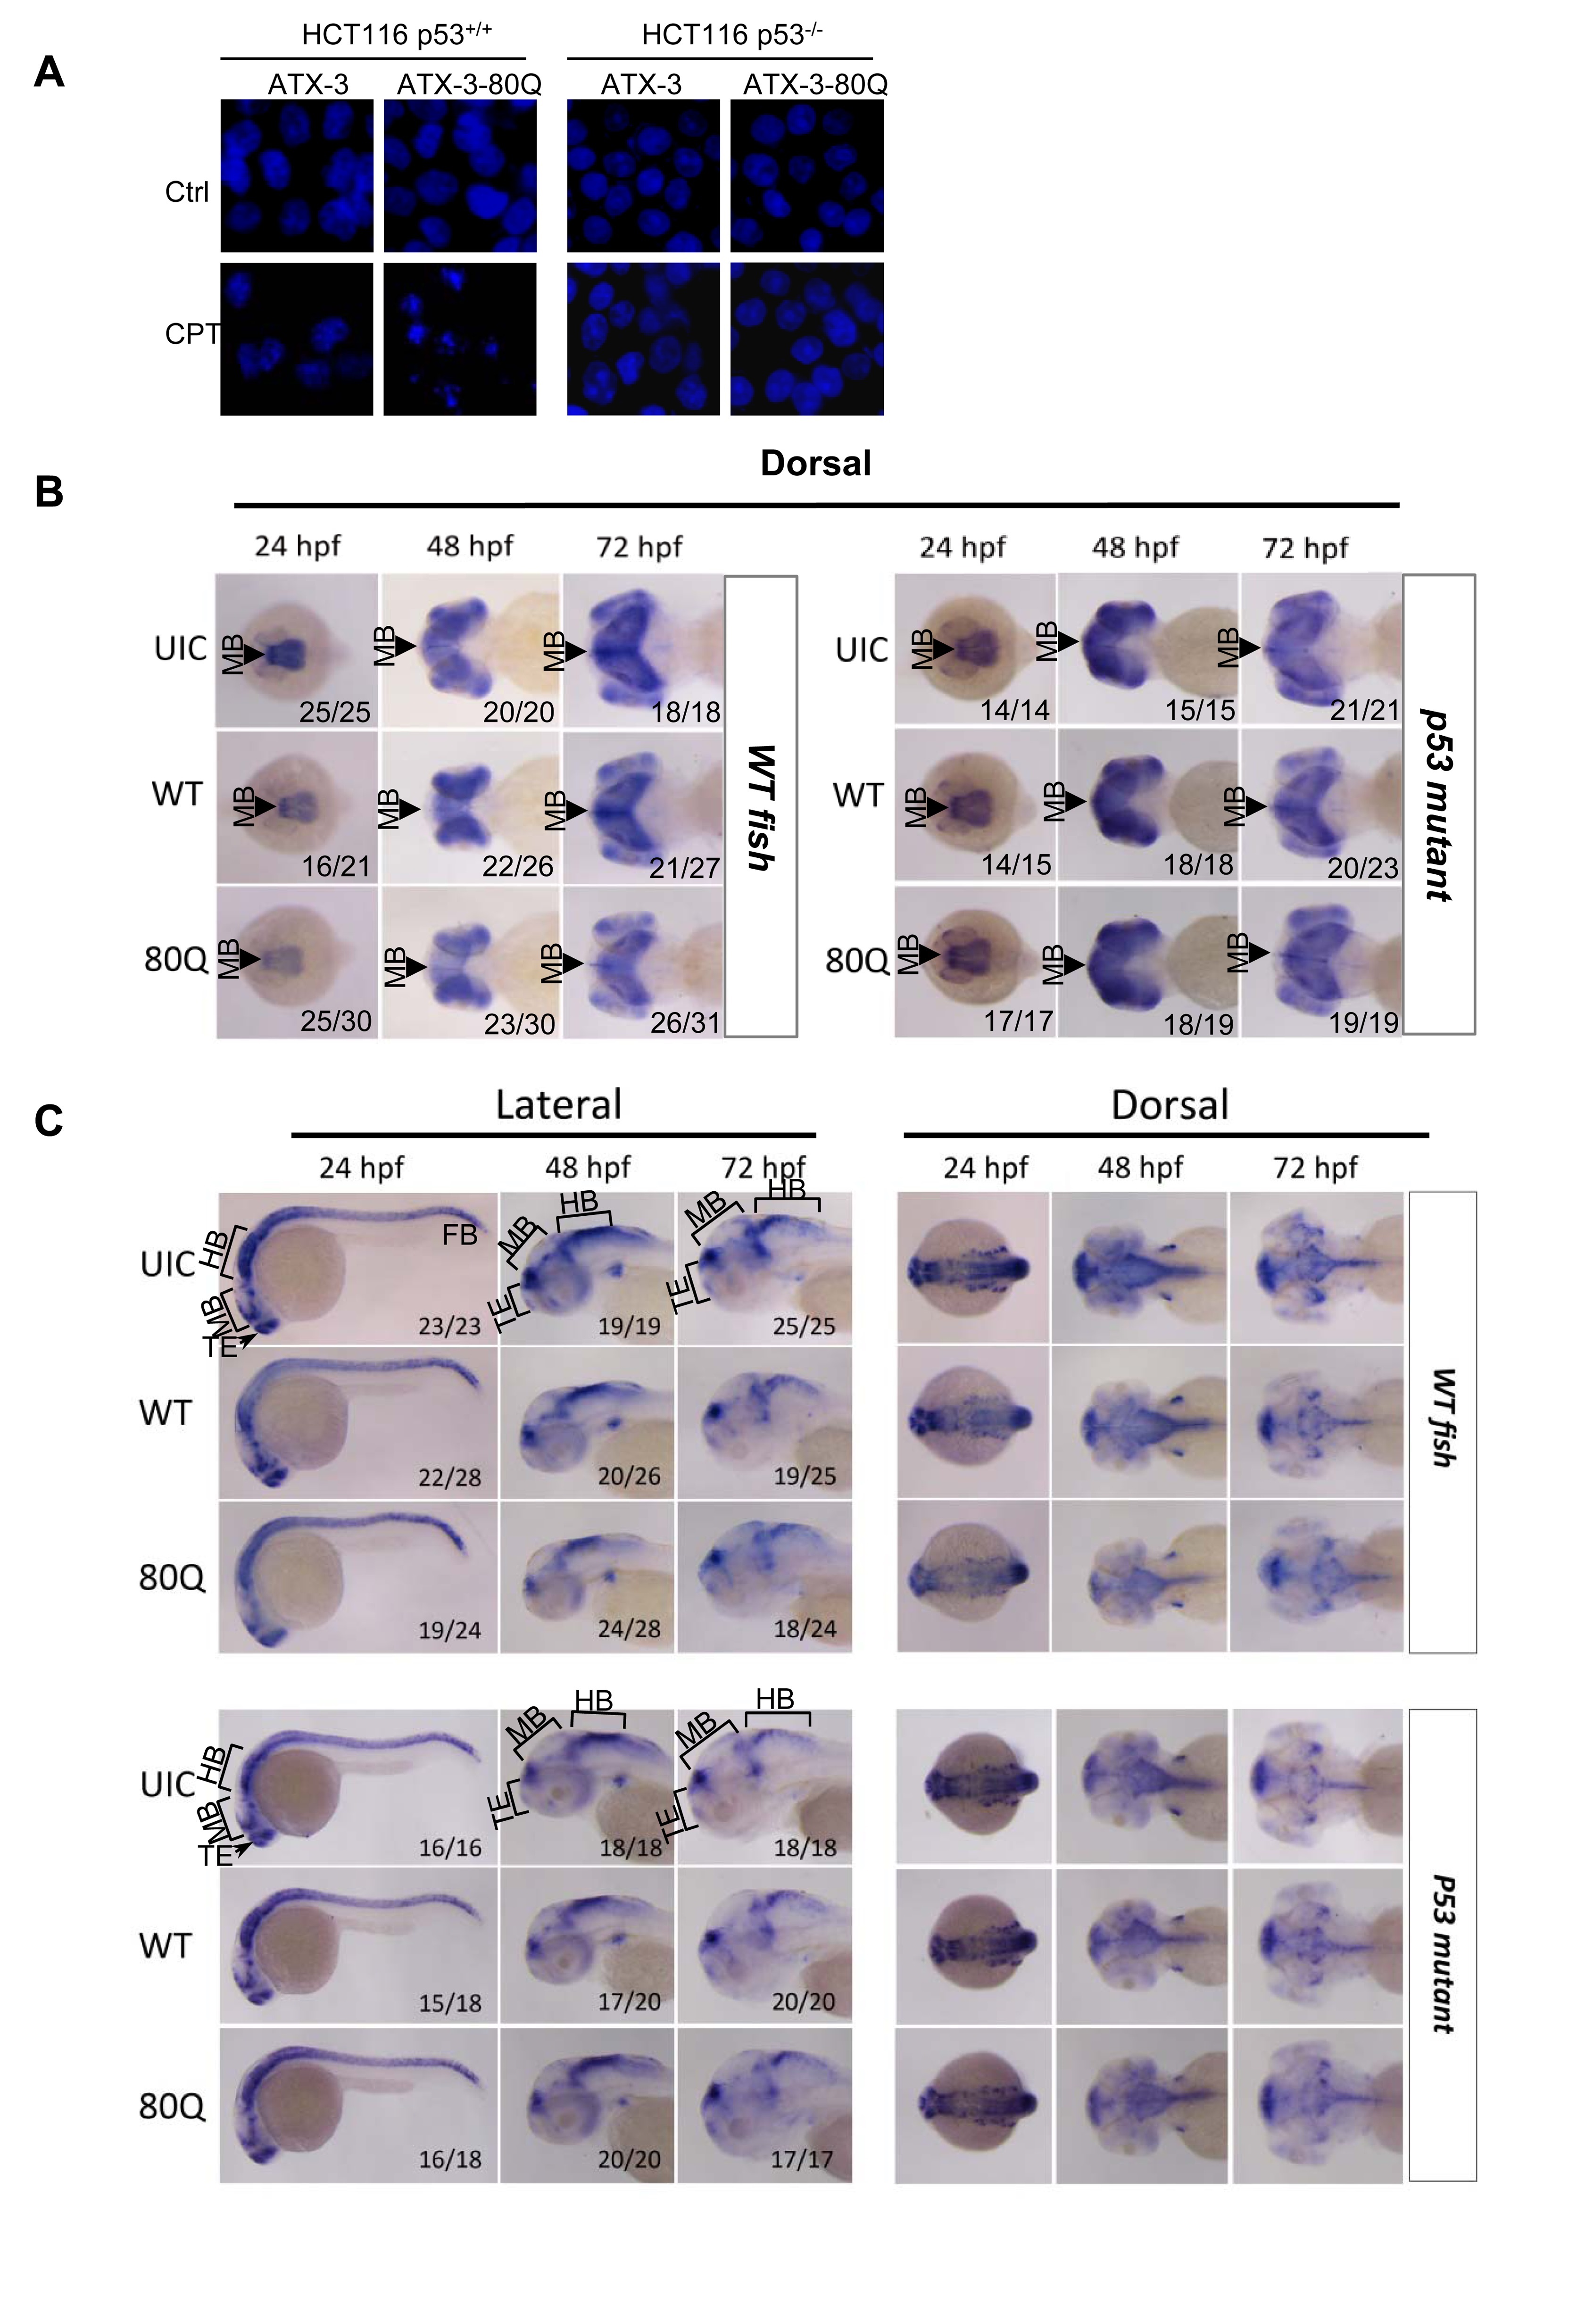
PolyQ expansion in ataxin-3 induces p53-dependent neurodegeneration in zebrafish.
(A) Normal, apoptotic and late apoptotic/necrotic cells were observed by staining of nuclear DNA with Hoechst-33342 under fluorescence microscopy. HCT116 p53+/+ and HCT116 p53-/- cells transiently transfected with Flag-ataxin-3-80Q or Flag-ataxin-3 were left untreated (upper) or treated with 1μM of CPT (lower) for 24h. Cells were fixed with 4% paraformaldehyde in PBS and their nuclear DNA was stained with Hoechst-33342 for detection of necrosis and apoptosis by morphological features. (B) Whole-mount in situ hybridization analyses of the midbrain neural marker otx2 in uninjected control (UIC) or normal ataxin-3 (WT) or ataxin-3exp (80Q) mRNA-injected WT (left) and p53 mutant (right) zebrafish embryos at 24, 48, and 72 hpf. Embryos were shown in dorsal views with anterior to the left. The ratio of embryos with the representative phenotypes was indicated. Both WT and 80Q mRNA injections resulted in obvious otx2 signal decreases (indicated by arrowheads) in wild-type but not p53 mutant zebrafishes, with more profound otx2 signal loss in 80Q mRNA injections. MB denotes midbrain. (C) Whole-mount in situ hybridization analyses of the central nervous system marker ngn1 in UIC or normal ataxin-3 (WT) or ataxin-3exp (80Q) mRNA injected-WT (upper) and p53 mutant (lower) zebrafish embryos at 24, 48, and 72 hpf. Embryos were shown in both lateral views (left) and dorsal views (right) with anterior to the left. The ratio of embryos with the representative phenotypes was indicated. TE denotes telencephalon; MB denotes midbrain; HB denotes hindbrain.