
Image
|
Figure Caption
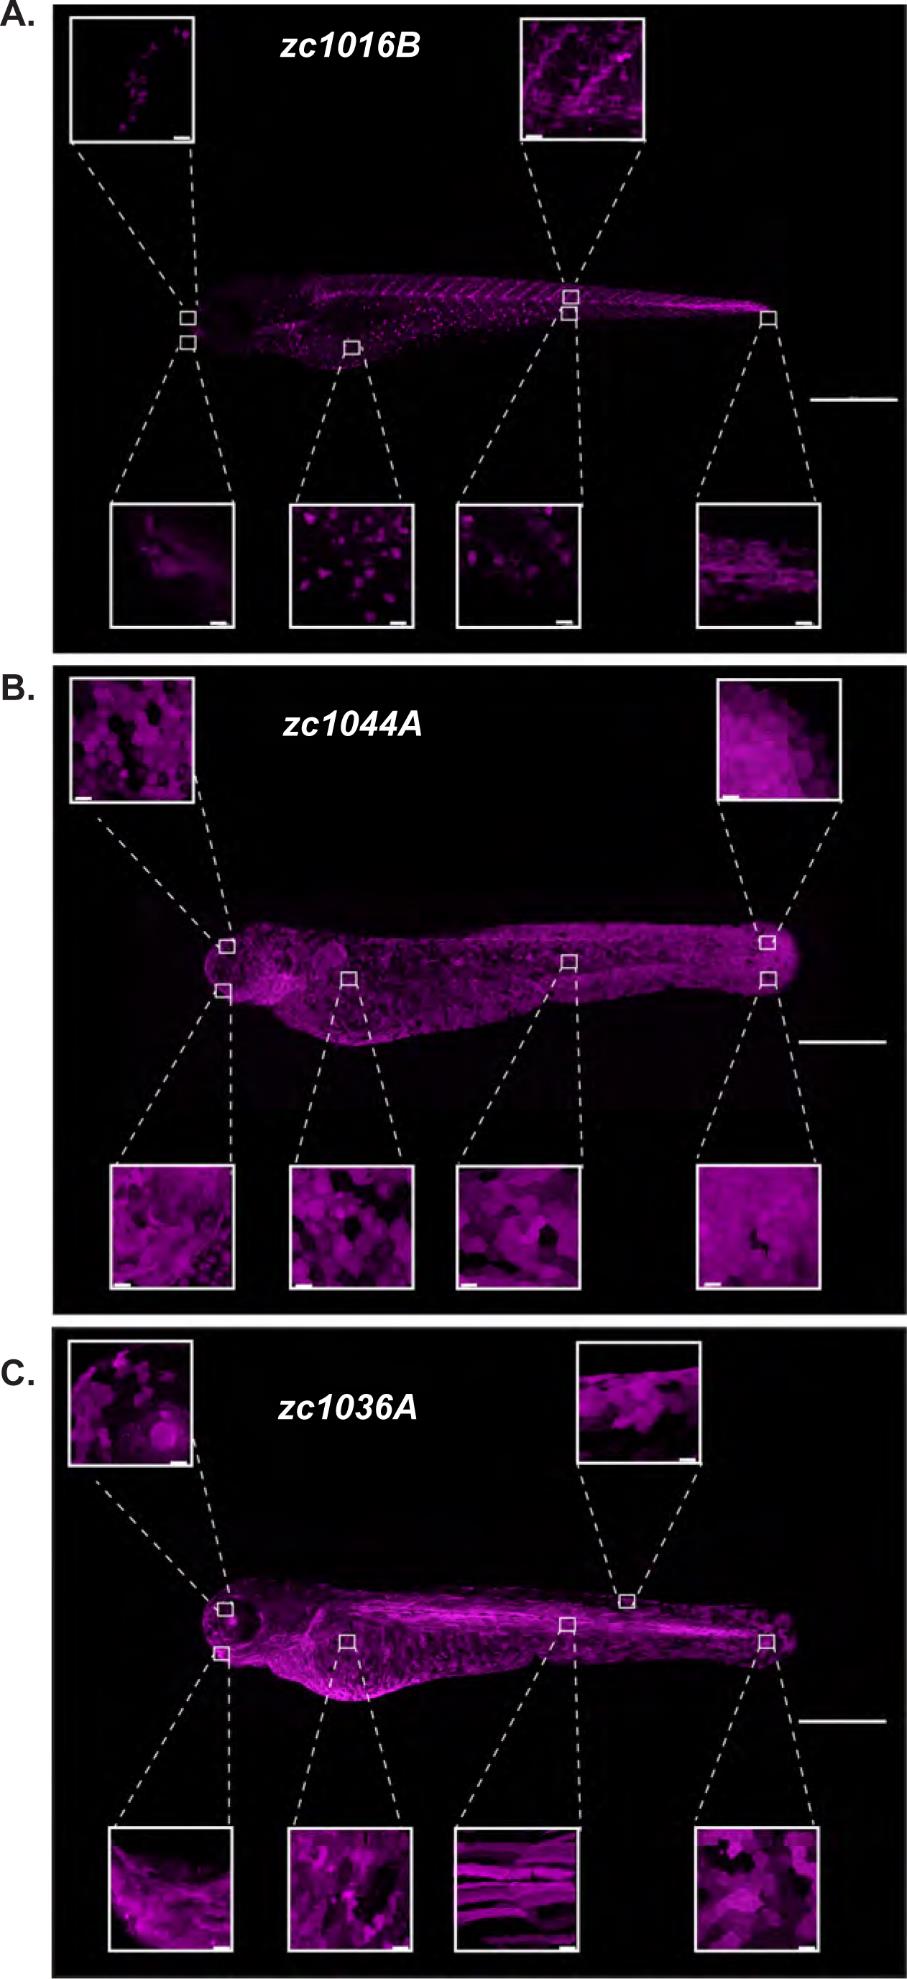
Fig. S3
High-resolution atlas of the identified Gal4 enhancer trap lines. Max projection confocal images demonstrating expression in the whole animal for the GET-ionocyte (A), GET-Periderm (B) and GET-Basal (C) lines. High magnification images of different regions along the animal for each Gal4 enhancer trap line are also shown. A list of cell types each line is expressed in is presented in Table S1. Depending on the experiment and approach, expression in other cell types may complicate perturbation studies. Scale bars, 50μm for the whole animal images, 20μm for the high magnification images.
Acknowledgments
This image is the copyrighted work of the attributed author or publisher, and
ZFIN has permission only to display this image to its users.
Additional permissions should be obtained from the applicable author or publisher of the image.
Full text @ J. Cell Sci.