
Image
|
Figure Caption
Fig. 3
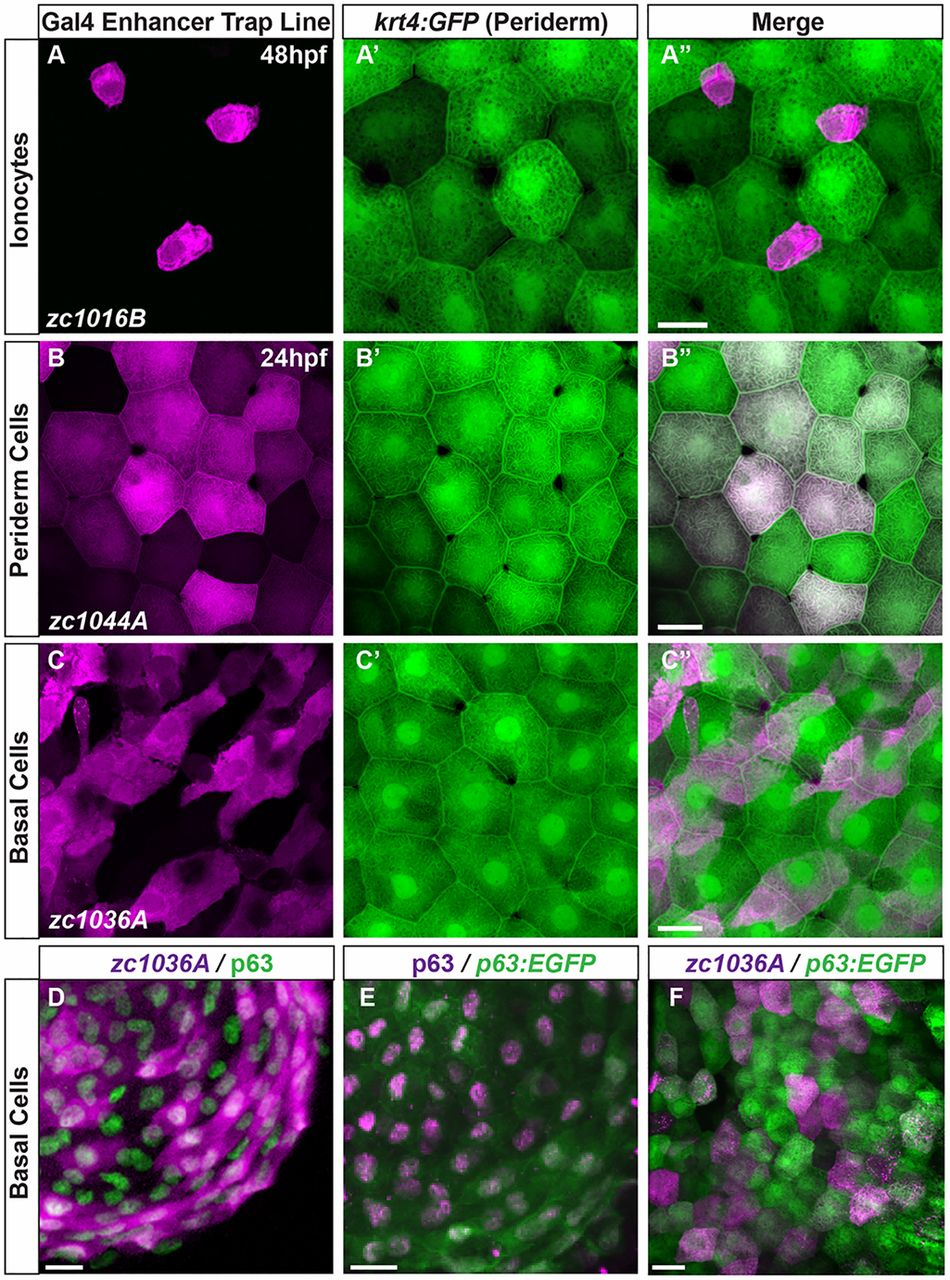
GAL4 enhancer trap lines are expressed in a subset of different epithelial cell types. (A-C) Maximum intensity projections of confocal images demonstrate expression of Gal4 enhancer trap lines (magenta) with respect to the periderm, shown by krt4:GFP expression (green). (D-F) Characterization of the basal cell line with antibody staining for (D) p63 and the GET-basal line (zc1036A), (E) p63 enhancer driving GFP stained with p63 antibody, and (F) p63:EGFP co-localization with the GET-basal line. Scale bars: 25 μm.
Acknowledgments
This image is the copyrighted work of the attributed author or publisher, and
ZFIN has permission only to display this image to its users.
Additional permissions should be obtained from the applicable author or publisher of the image.
Full text @ J. Cell Sci.