
Image
|
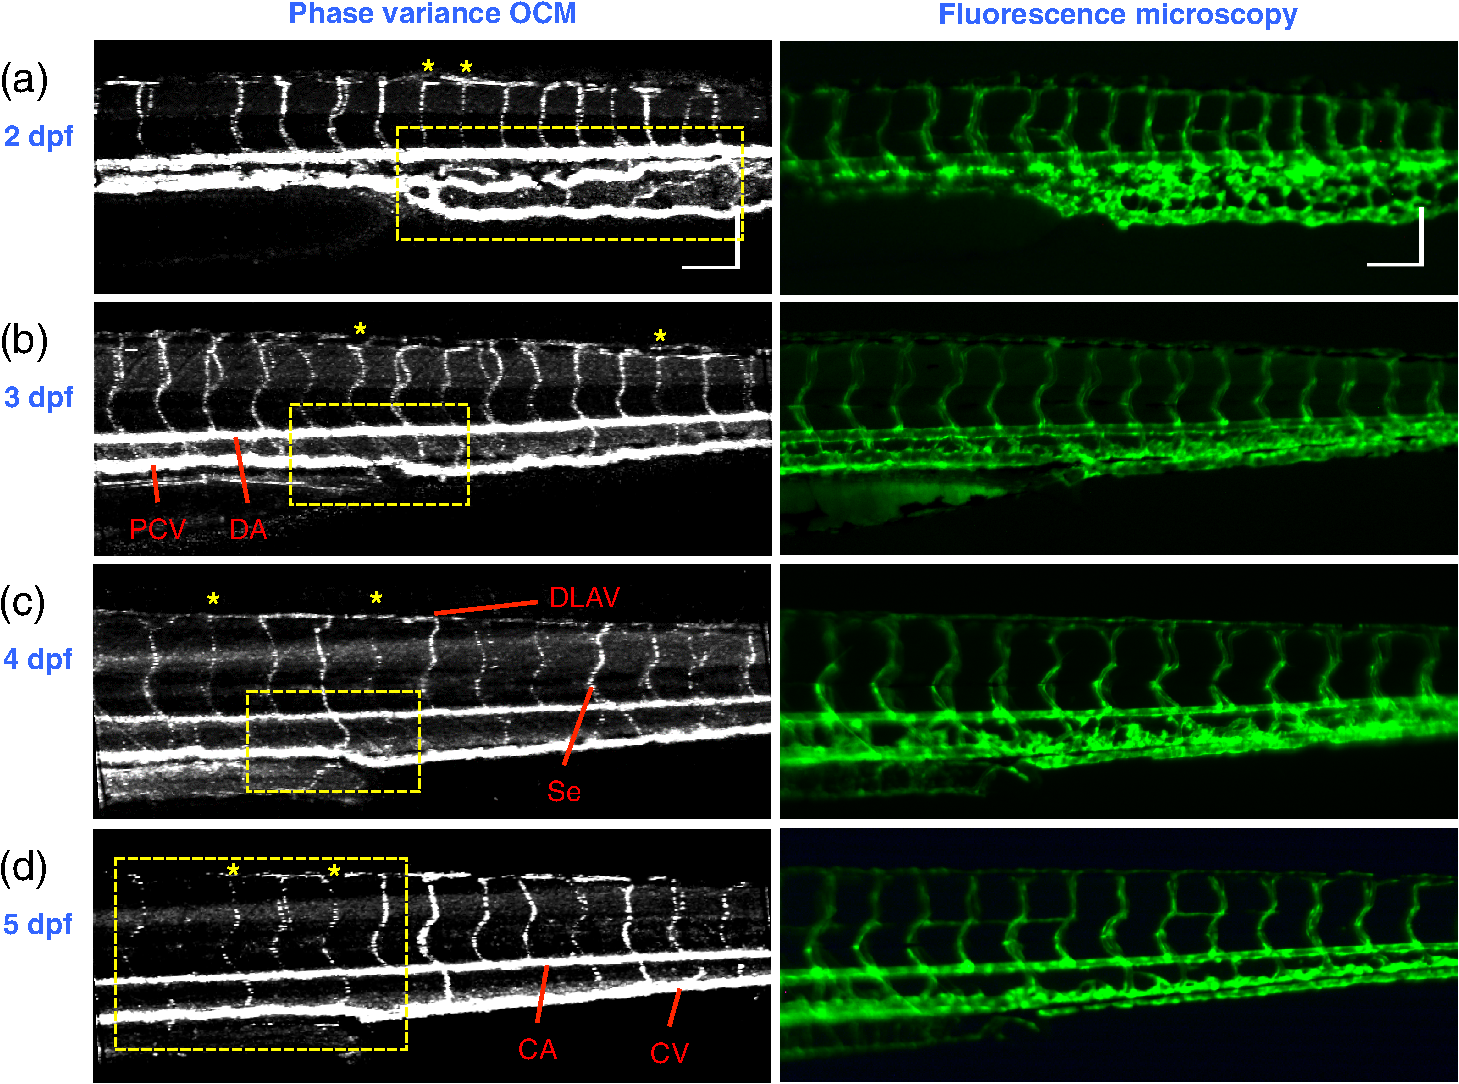
Figure Caption
Fig. 7
pvOCM images of the developing vascular system. Projection pvOCM images of zebrafish embryos at developmental stages of (a) 2 dpf, (b) 3 dpf, (c) 4 dpf, and (d) 5 dpf. All images were created by average intensity projection over entire depths across samples. Corresponding fluorescence microscopic images are shown on the right column for comparison. Yellow dashed boxes represent areas for analysis in Fig. 8. Scale bars: 100 μm.
Acknowledgments
This image is the copyrighted work of the attributed author or publisher, and
ZFIN has permission only to display this image to its users.
Additional permissions should be obtained from the applicable author or publisher of the image.
Full text @ J. Biomed. Opt.