
Image
|
Figure Caption
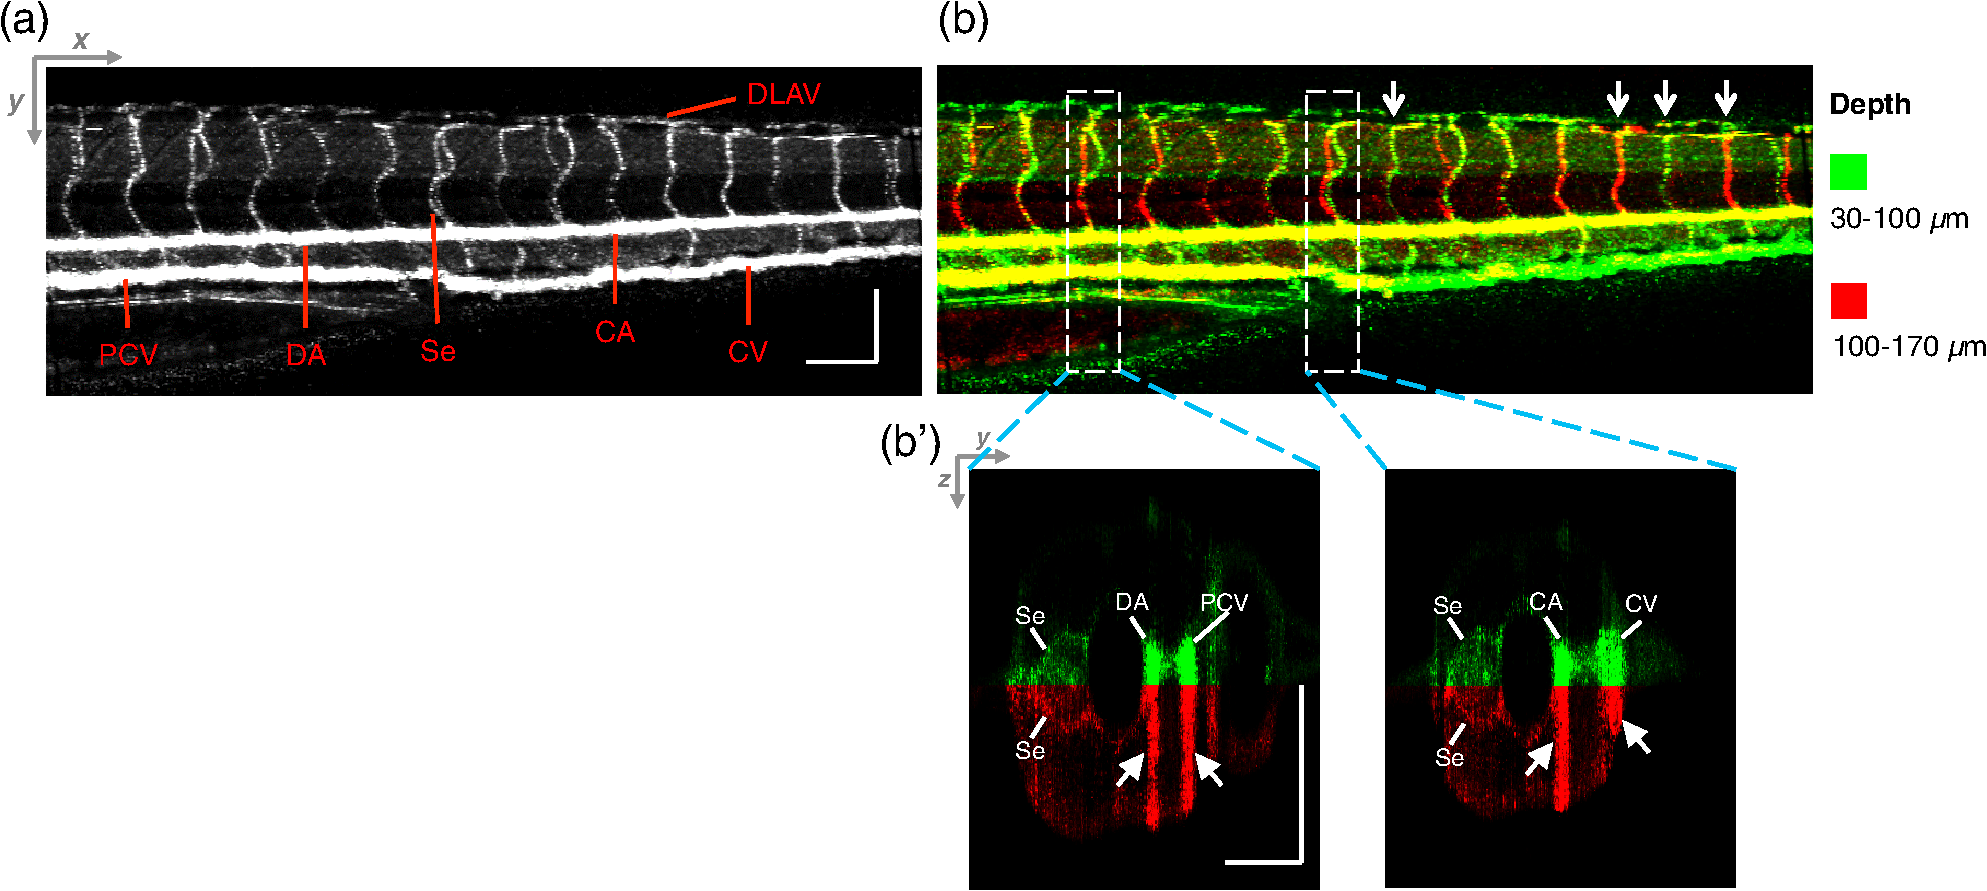
Fig. 6
Visualization of the microvascular network by pvOCM. (a) Projection pvOCM image, created by average intensity projection over the depth range of 30 to 170 μm below the top surface of the zebrafish trunk. (b) Depth color-coded projection pvOCM image, with green denoting the vasculature on the ipsilateral half and red denoting the vasculature on the contralateral half of the embryo. (b’) Sagittal views of pvOCM images are shown for two white dashed box areas in (b). White arrows mark projection artifacts below strong flow regions of the aorta and vein. Scale bars: 100 μm.
Acknowledgments
This image is the copyrighted work of the attributed author or publisher, and
ZFIN has permission only to display this image to its users.
Additional permissions should be obtained from the applicable author or publisher of the image.
Full text @ J. Biomed. Opt.