
|
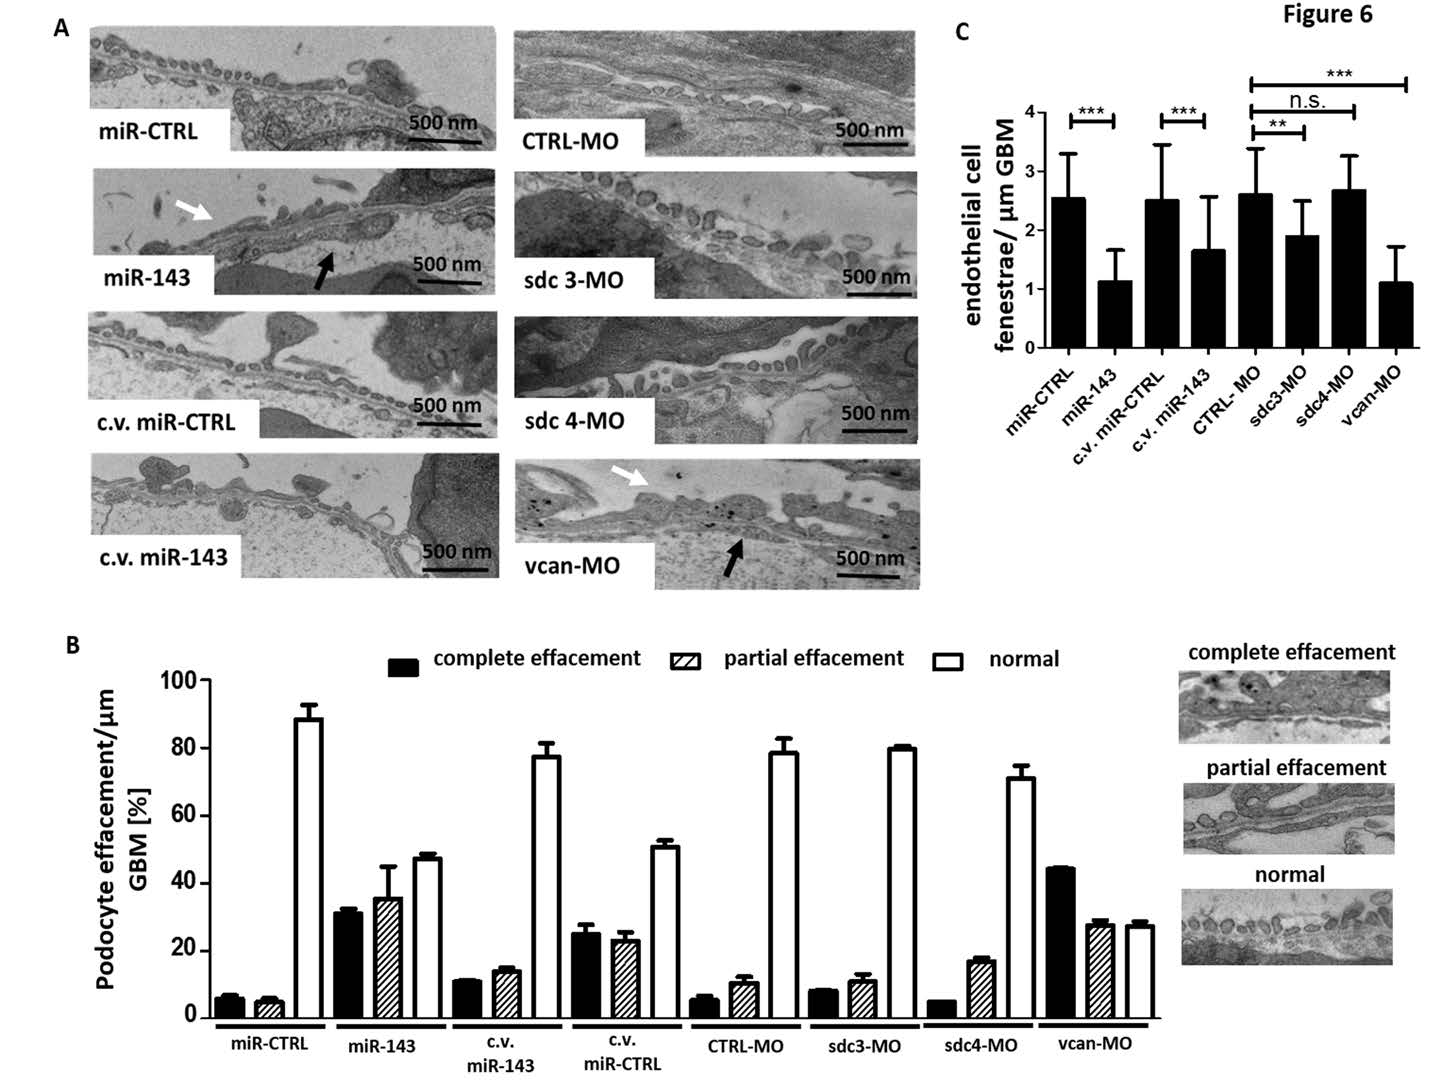
Fig. 6
Glomerular damage after miR-143 overexpression and knockdown of syndecan and versican in zebrafish larvae. (A) Transmission electron microscopy pictures of the pronephros of zebrafish larvae at 120 hpf after injection with a syndecan 3 morpholino (sdc3-MO, 100 μM), syndecan 4 morpholino (sdc4-MO, 100 μM), versican morpholino (vcan-MO, 100 μM) or control morpholino (CTRL-MO, 100 μM), as well miR- 143 mimic (miR-143, 5 μM) or miR control (miR-CTRL, 5 μM). White arrows illustrate podocyte effacement. Black arrows illustrates loss of endothelial cell fenestration. (Aa) Normal, partial and complete effacement of podocytes was quantified in the different groups. (Ab) Quantification endothelial cell fenestration per μm GBM. *** p<0.001, n.s. not significant.