
|
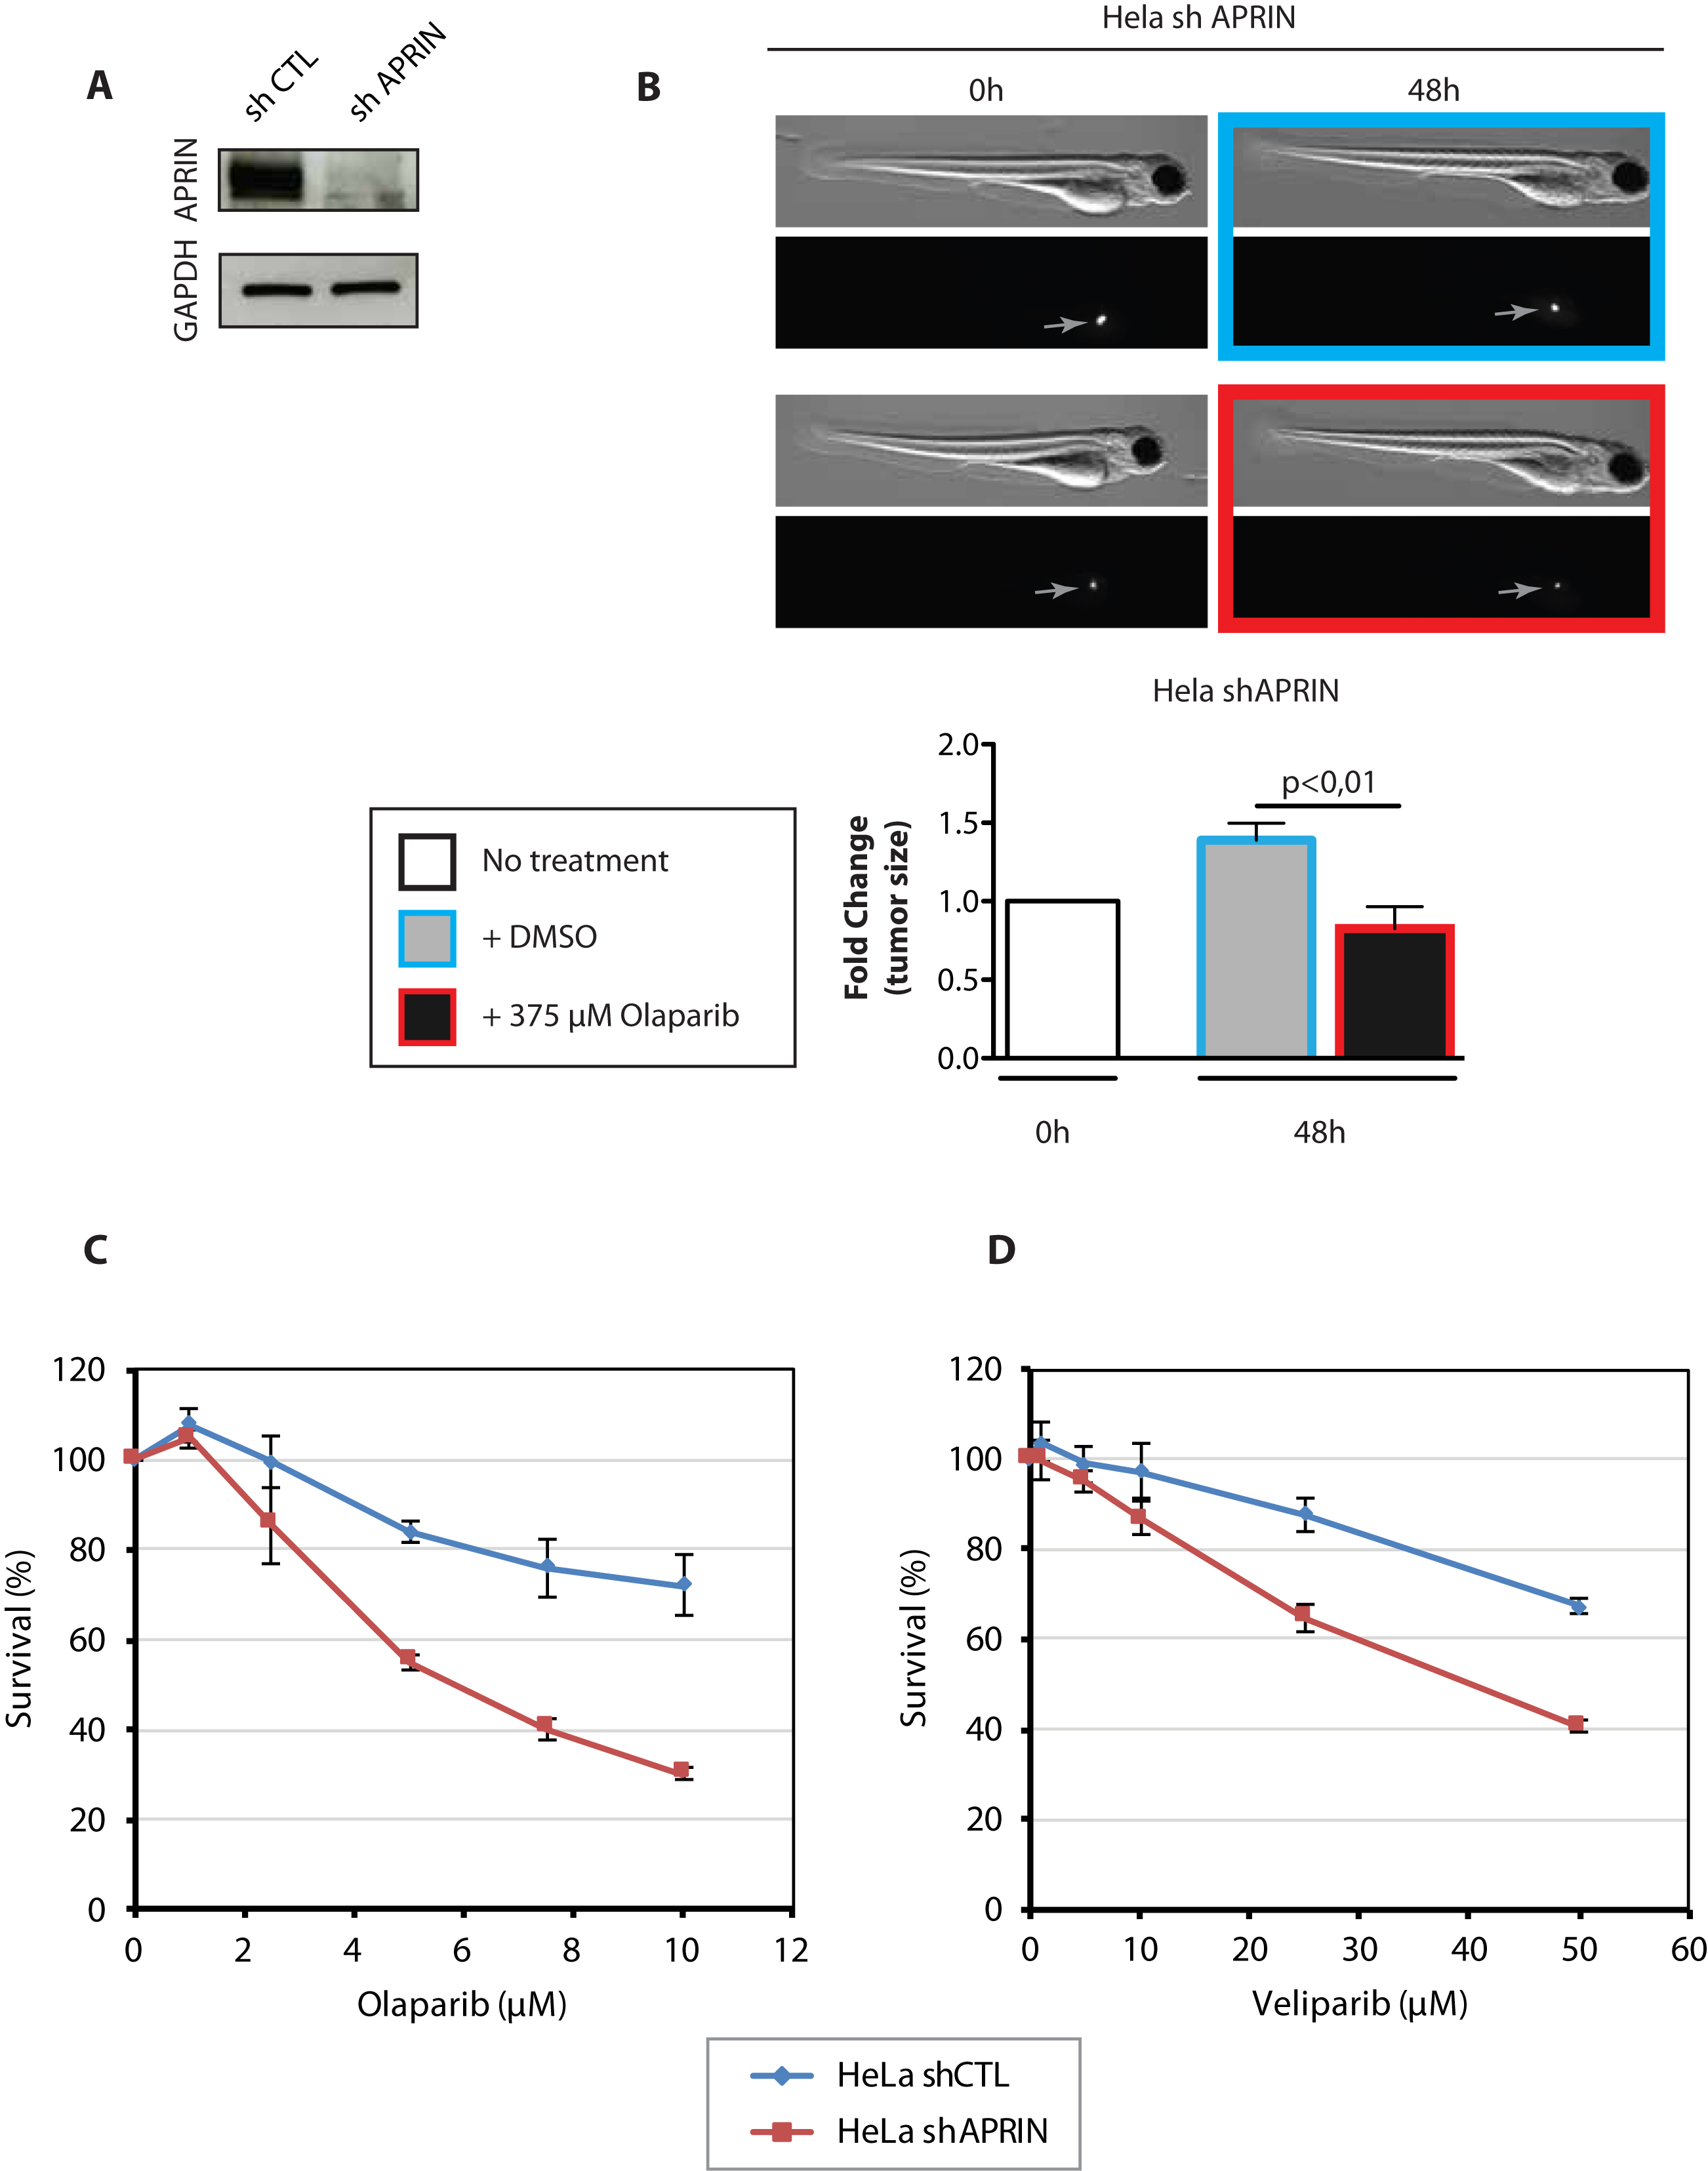
Fig. 7
APRIN-depleted HeLa cells are sensitive to PARP inhibitor treatment. (A) Western blot showing the depletion of APRIN using APRIN shRNA (shAPRIN) or control shRNA (shCTL). (B) Representative bright field and fluorescent images of zebrafish (top) along with the bar graphs showing cellular proliferation in vivo (bottom). Uniform fluorescent mass is indicated by the gray arrow. An unpaired two-tailed Student's t-test or one-way ANOVA followed by Dunnett's multiple comparison test were used when appropriate. P-values of <0.05 were considered significant. Results are reported as mean ± SEM. (C) Survival curves obtained from MTT assays on shCTL or shAPRIN HeLa cells in presence of PARP inhibitor Olaparib at the indicated concentration. (D) Survival curves obtained from MTT assay on shCTL or shAPRIN HeLa cells in presence of PARP inhibitor Veliparib. Error bars represent the corresponding Standard Error. Survival experiments have been performed for 5 days.