
|
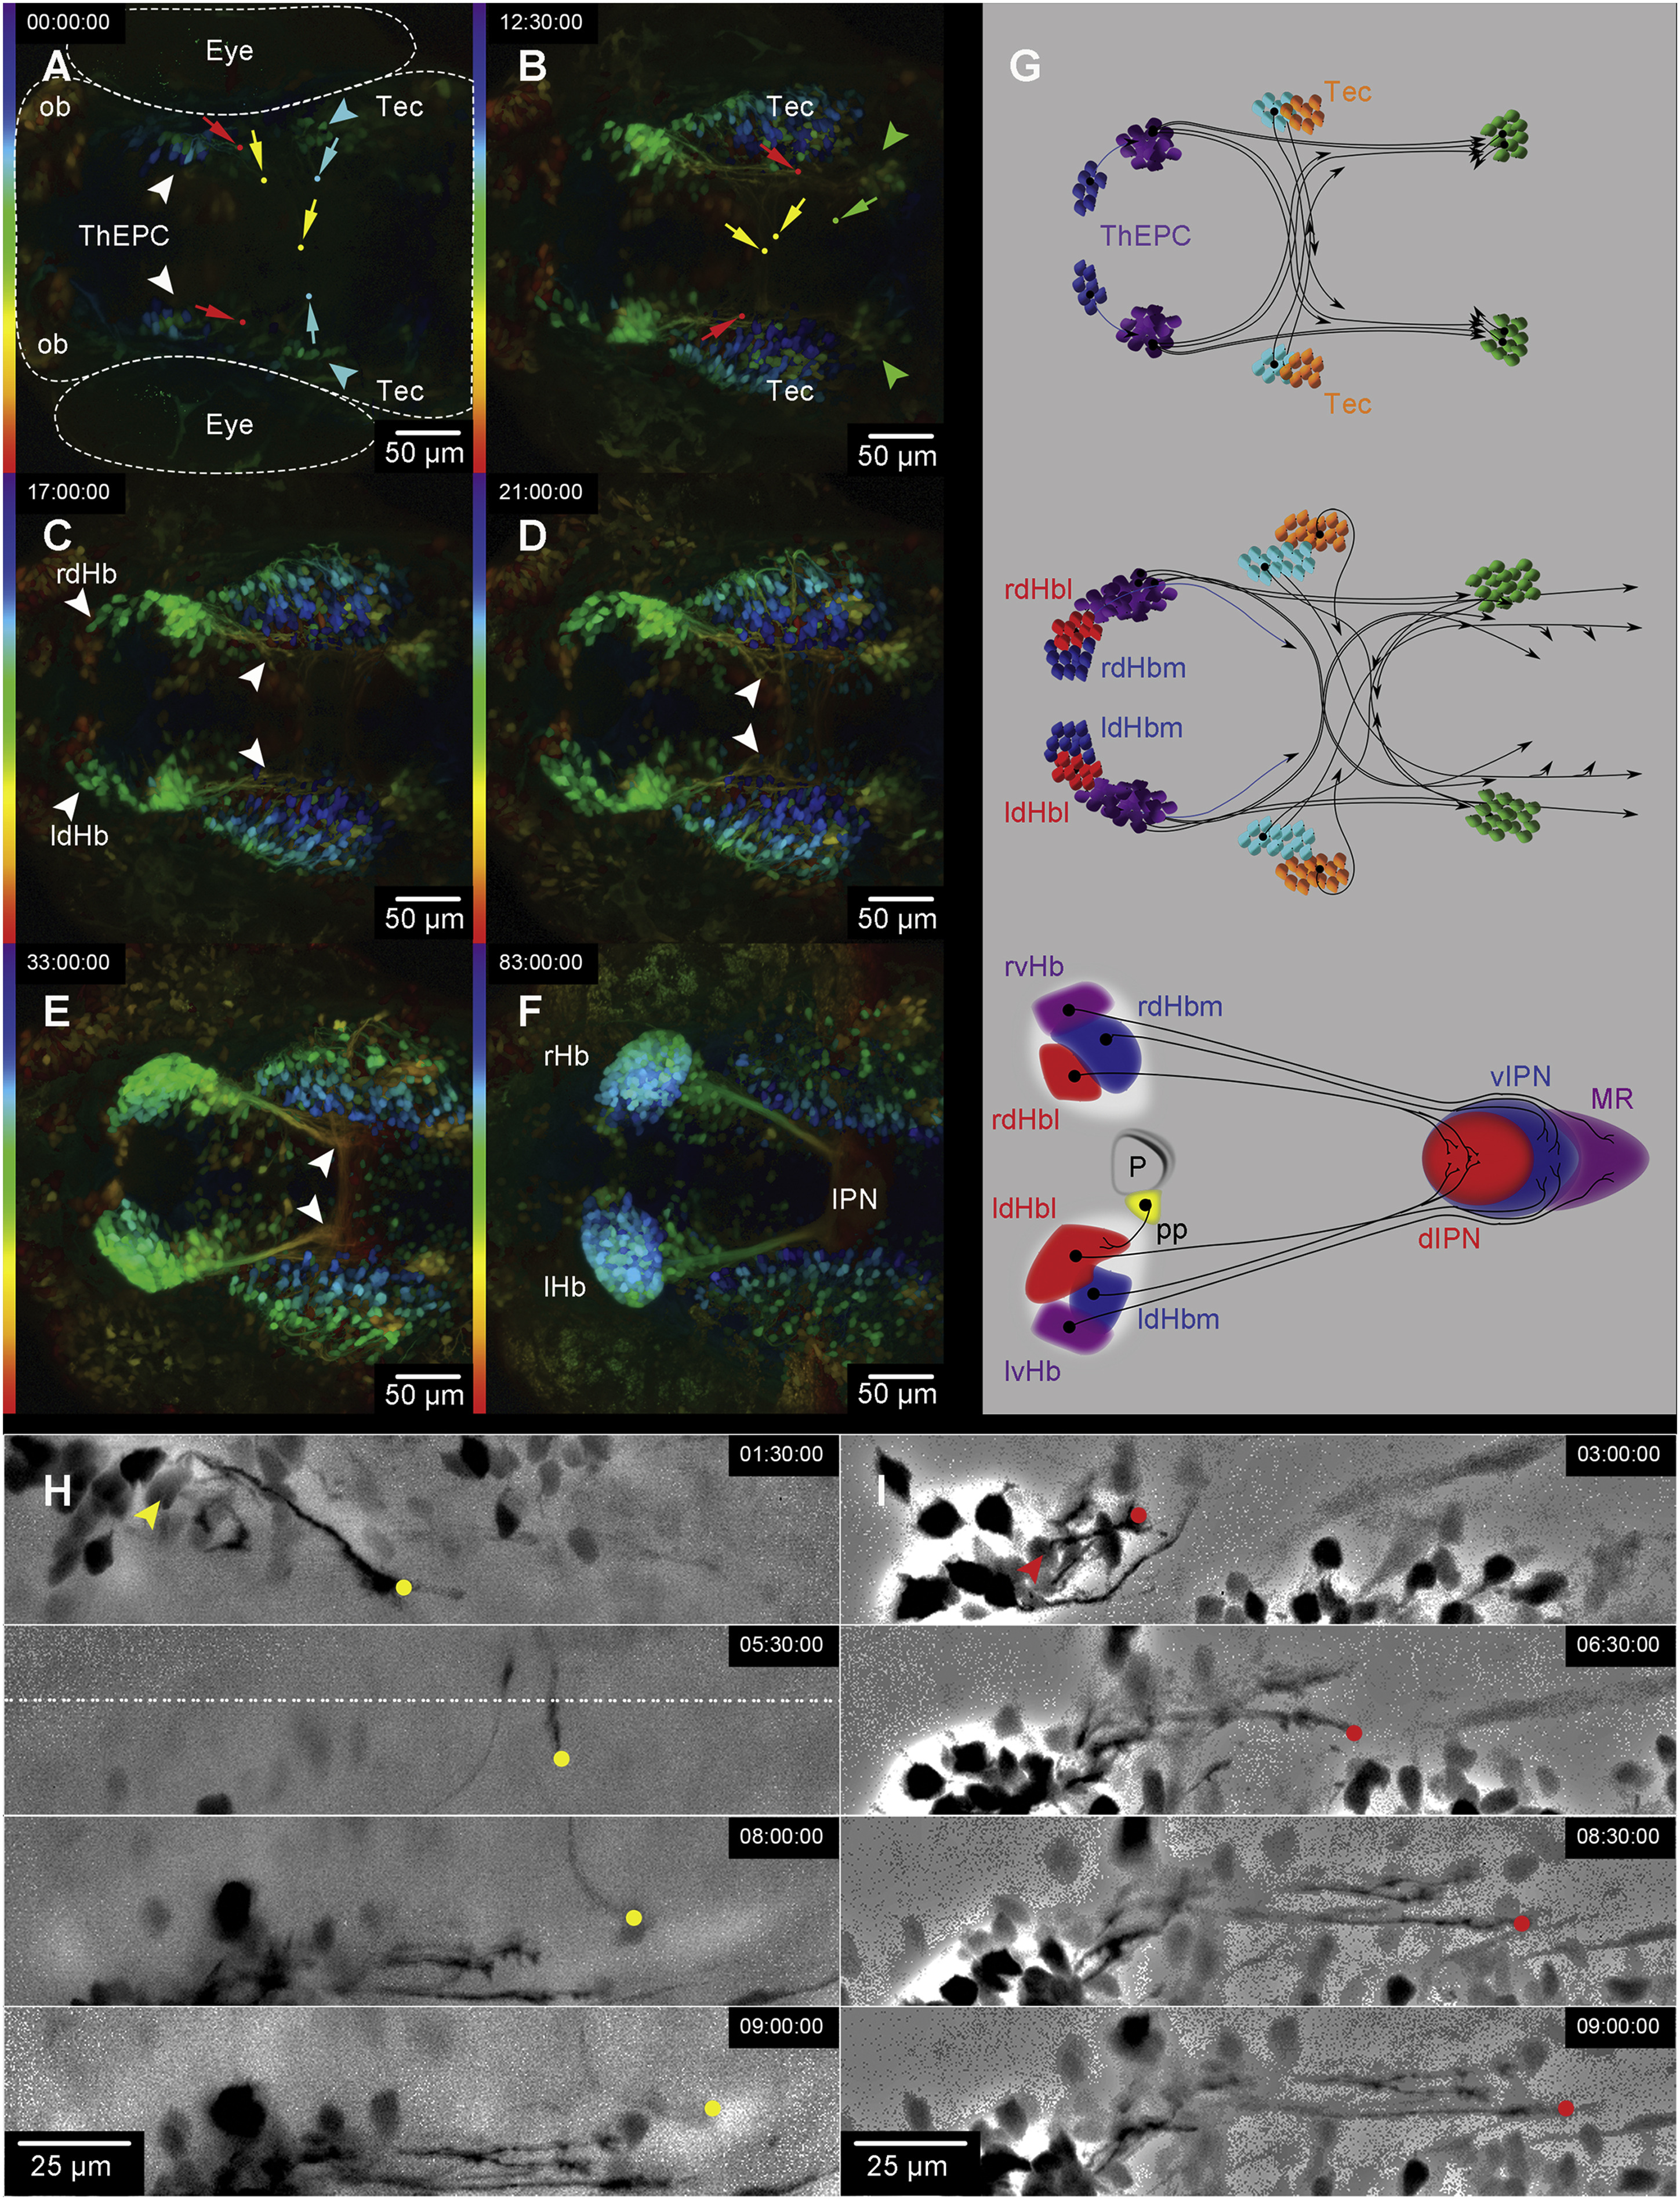
Fig. 1
Long-Term 2-PM In Vivo Recording Identifies Two Intersected Neural Circuits
(A–F) Dorsal view, anterior to the left, color-coded MIP, of six developmental stages acquired by in vivo 2-PM of Et(−1.0otpa:mmGFP)hd1 transgenic embryos. The LUT shows the z color-coded table according to the depth of each slice. The experiment time (hr:min:s) is shown in the left upper corner. Original stacks were cropped and gamma was adjusted to a value of 0.45 for display purposes. The head morphology has been roughly outlined in (A) for orientation.
(A and B) White arrowheads mark the ThEPCs at (A) 32 hpf and (B) 44.5 hpf; blue and green arrowheads mark two posterior bilateral clusters of projecting neurons. Red and yellow dots and directional arrows mark the tips of ThEPC axons projecting ipsi- and contralaterally, respectively. Blue and green dots and directional arrows highlight tips of axons from the second and third cluster of contralaterally projecting neurons, respectively.
(C) White arrowheads highlight the bilateral expression of GFP in dHb neurons and navigating dHb efferent axons at 49 hpf.
(D and E) White arrowheads highlight dHb efferent projections (D) navigating toward the midline before IPN innervation at 53 hpf and (E) thereafter at 65 hpf.
(F) Architecture of the habenular neural circuit at 5 dpf.
(G) Summary of events during habenular neural circuit development between (top to bottom) 32 and 44.5 hpf, 32 and 53 hpf, and 32 hpf and 5 dpf. ThEPCs, purple; Tec, orange; second cluster of projection neurons, light blue; third cluster of projection neurons, green; ldHb/rdHb and axonal targets, blue/red. Some ThEPC neurons form the vHb [11]. Therefore, the lvHb/rvHb and axonal targets are shown in purple. Note that the schemes do not show the exact number or position of all axons.
(H and I) Dorsal views, anterior to the left, focused on early ThEPC neural network formation between (H) 34.5 and 42 hpf and (I) 36 and 42 hpf. The dotted line indicates the embryonic midline. Yellow and red dots highlight the tips of a commissural and an ipsilaterally projecting ThEPC axon, respectively. Yellow and red arrowheads mark the corresponding projection neuron. MIPs were adjusted using the difference of Gaussians to better visualize the structure of interest.
d, dorsal; Hb, habenula; Hbl, lateral habenula; Hbm, medial habenula; IPN, interpeduncular nucleus; l, left; LUT, lookup table; MR, median raphe; ob, olfactory bulb; P, pineal; pp, parapineal; r, right; Tec, optic tectum; ThEPC, thalamic-epithalamic early projecting cluster; v, ventral. See also Figures S1 and S2 and Movies S1 and S2.