
|
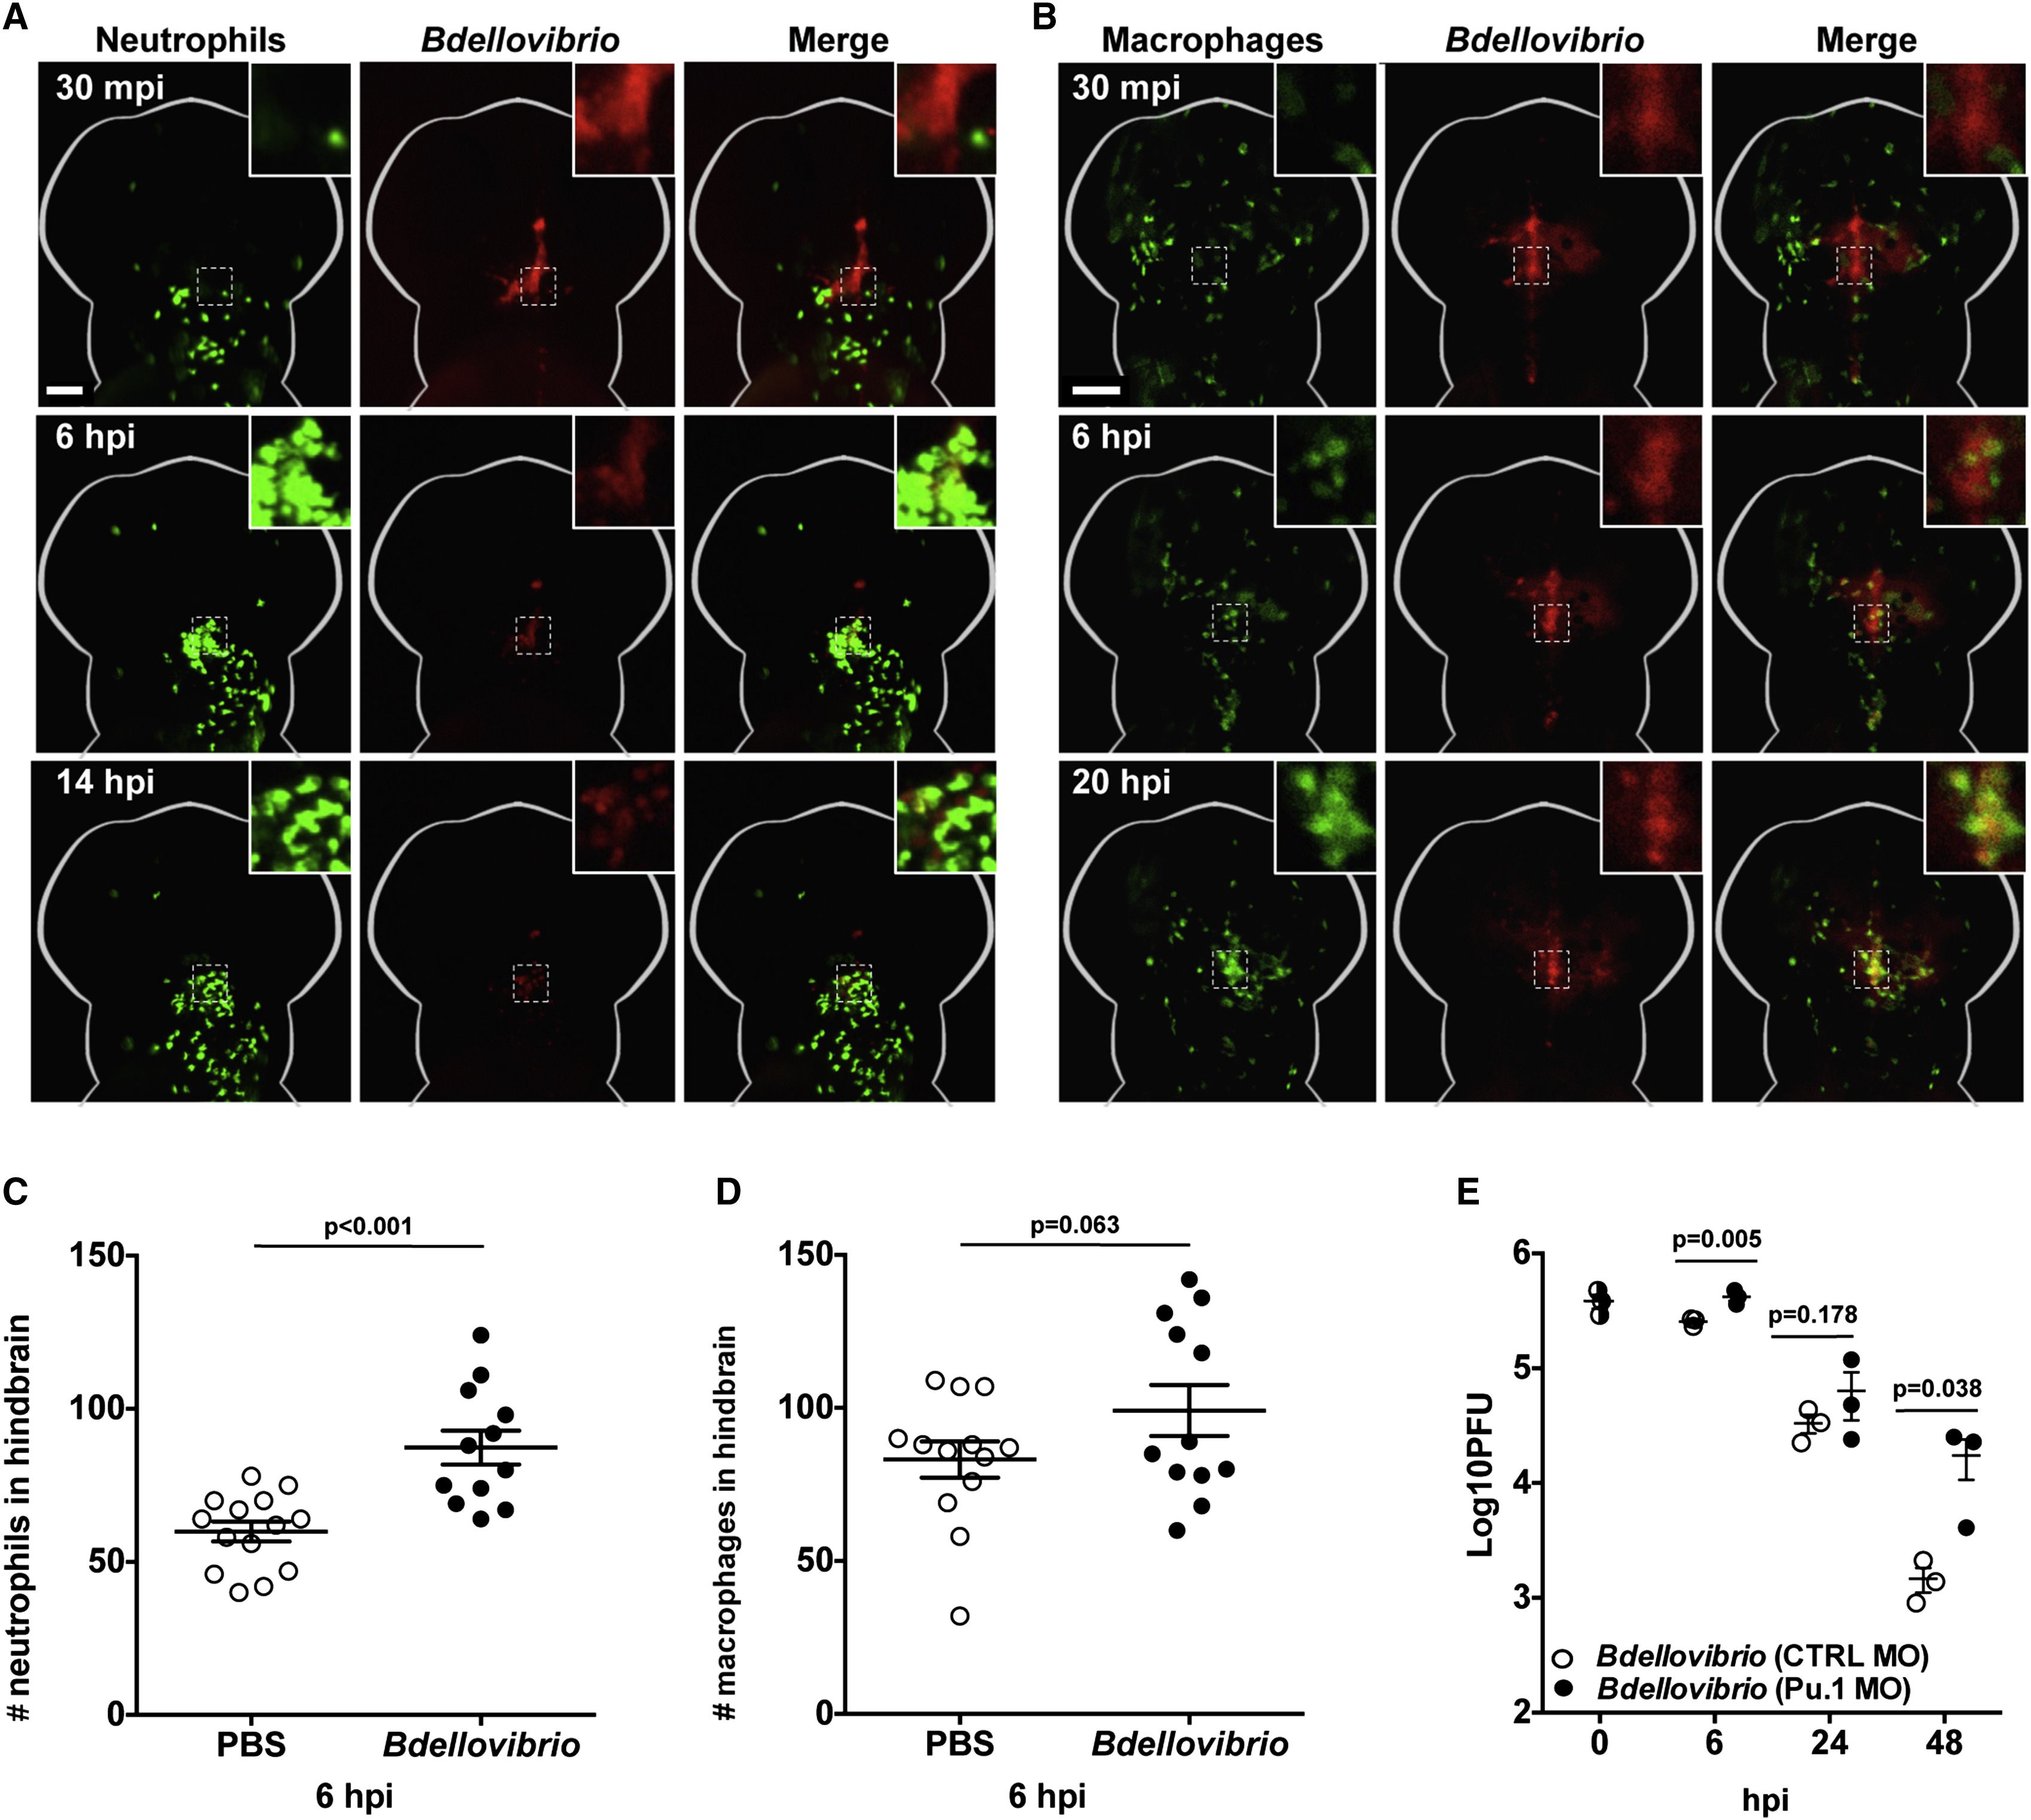
Fig. 3
Bdellovibrio Is Recognized and Engulfed by Zebrafish Leukocytes In Vivo
(A) 1–2 × 10⁵ PFUs of mCherry-Bdellovibrio were injected into the hindbrain ventricle of Tg(mpx:GFP)i114 zebrafish larvae at 3 dpf, and interactions between neutrophils (green) and Bdellovibrio (red) were visualized by fluorescent stereomicroscopy. Representative images from a single larva over time are shown. Scale bar, 100 μm. See also Movie S3.
(B) 1–2 × 10⁵ PFUs of mTeal-Bdellovibrio were injected into the hindbrain ventricle of Tg(mpeg1:Gal4-FF)gl25/Tg(UAS-E1b:nfsB.mCherry)c264 zebrafish larvae at 3 dpf, and interactions between macrophages (green) and Bdellovibrio (red) were visualized by fluorescent stereomicroscopy. Representative images from a single larva over time are shown. Scale bar, 100 μm. See also Movie S3.
(C) Tg(mpx:GFP)i114 zebrafish larvae were injected with PBS or Bdellovibrio as in (A), and GFP-expressing neutrophils present in the head region were quantified at 6 hpi. Each circle represents a count from an individual larva. Data are pooled from two independent experiments. The p value between conditions was determined by unpaired one-tailed Student’s t test. Significance was defined as p < 0.05.
(D) Tg(mpeg1:Gal4-FF)gl25/Tg(UAS-E1b:nfsB.mCherry)c264 zebrafish larvae were injected with PBS or Bdellovibrio as in (B), and mCherry-expressing macrophages present in the head region were quantified at 6 hpi. Each circle represents a count from an individual larva. Data are pooled from two independent experiments. The p value between conditions was determined by unpaired one-tailed Student’s t test. Significance was defined as p < 0.05.
(E) Tg(mpx:GFP)i114 zebrafish larvae were pre-treated using control (CTRL) or Pu.1-targeting morpholino (MO) to deplete leukocytes. Morphants were injected in the hindbrain ventricle at 3 dpf with either PBS or 3–5 × 10⁵ PFU mCherry-Bdellovibrio. Live Bdellovibrio were enumerated from PBS homogenates of larvae. Each circle represents a count from an individual larva. Half-filled circles represent enumerations from larvae at time 0 and are representative of inocula for both conditions. Mean ± SEM (horizontal bars) is shown. The p value (between conditions at cognate time points) was determined by unpaired one-tailed Student’s t test. Significance was defined as p < 0.05. As inoculums from independent experiments were variable up to a log-fold, a representative of three independent experiments performed is shown. See also Figure S2E.
See also Figure S2.