
|
Fig. 5
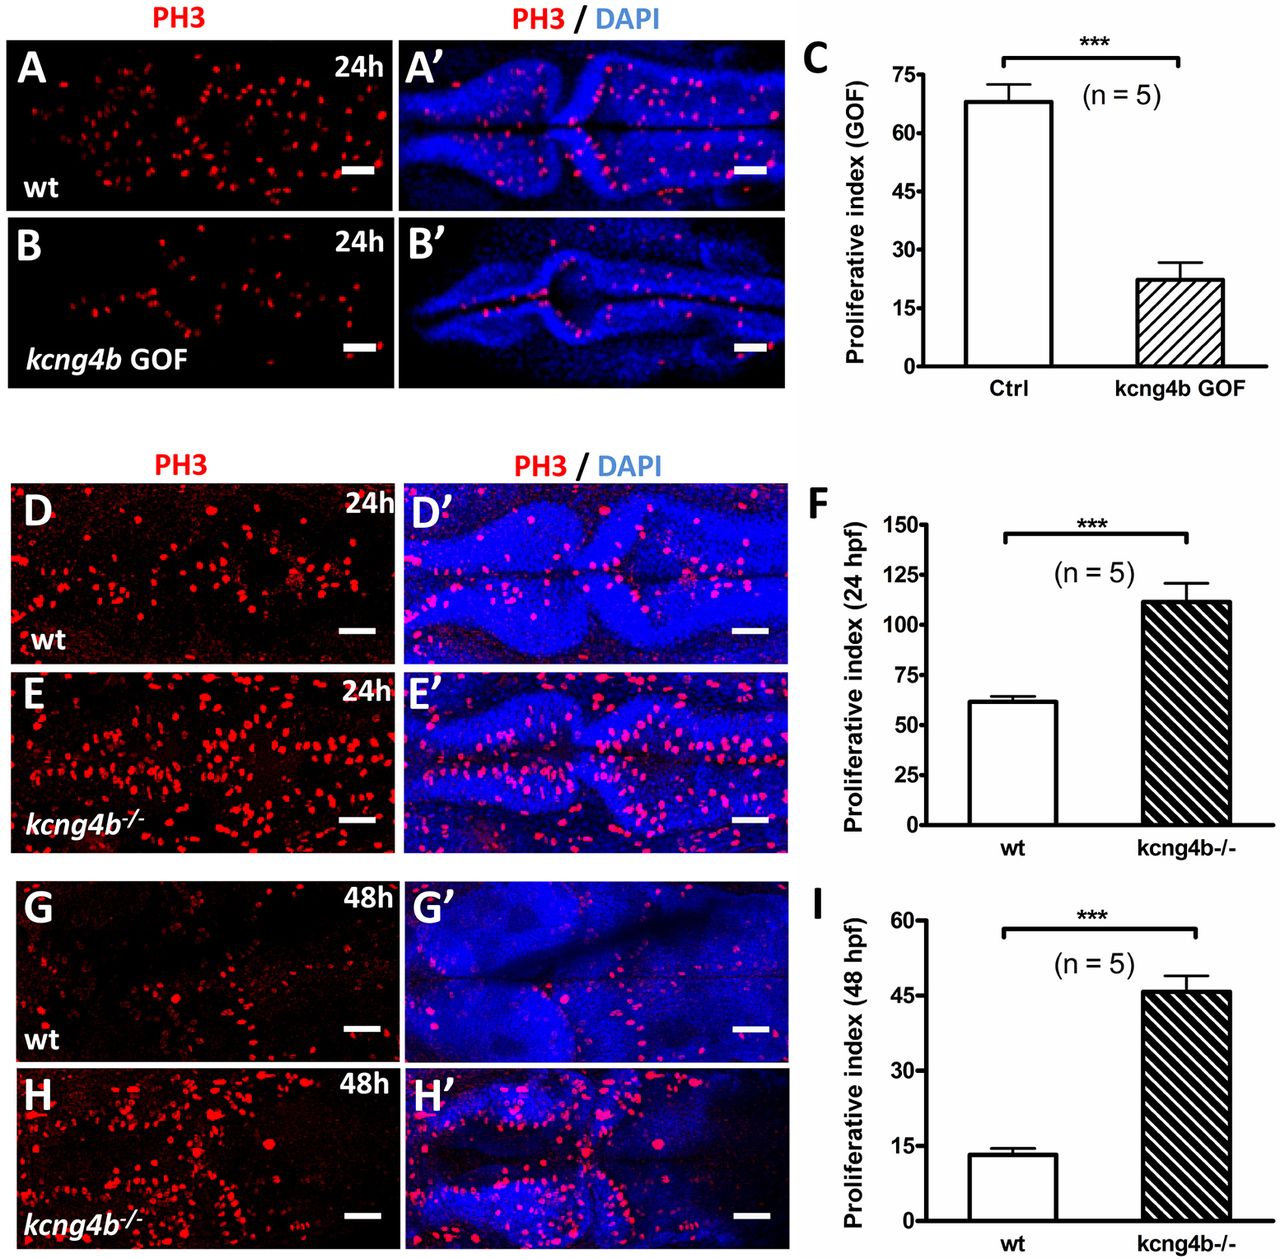
kcng4b modulates proliferation in neuroepithelium. (A-B′) Confocal projection view of Z-scans of embryos stained for phospho-histone 3 (PH3) and DNA (DAPI) at 24 hpf. Dorsal views, anterior to the left. (C) Proliferative index in control and kcng4b GOF embryos. Proliferative index was calculated by counting the number of PH3-positive cells and DAPI-positive neuroepithelial cells of each single confocal optical section using ImageJ cell count function, and expressed as summation of the total number of PH3-positive cells of whole Z-scans per 1000 neuroepithelial cells. ***P<0.001; unpaired t-test, n=5. (D-I) Confocal projection view of Z-scans of control and kcng4b−/− embryos stained at 24 hpf (D-E′) and 48 hpf (G-H′). (F,I) Proliferative index in controls and kcng4b mutants at 24 (F) and 48 hpf (I). ***P<0.001; unpaired t-test, n=5. Scale bars: 50 µm.