
|
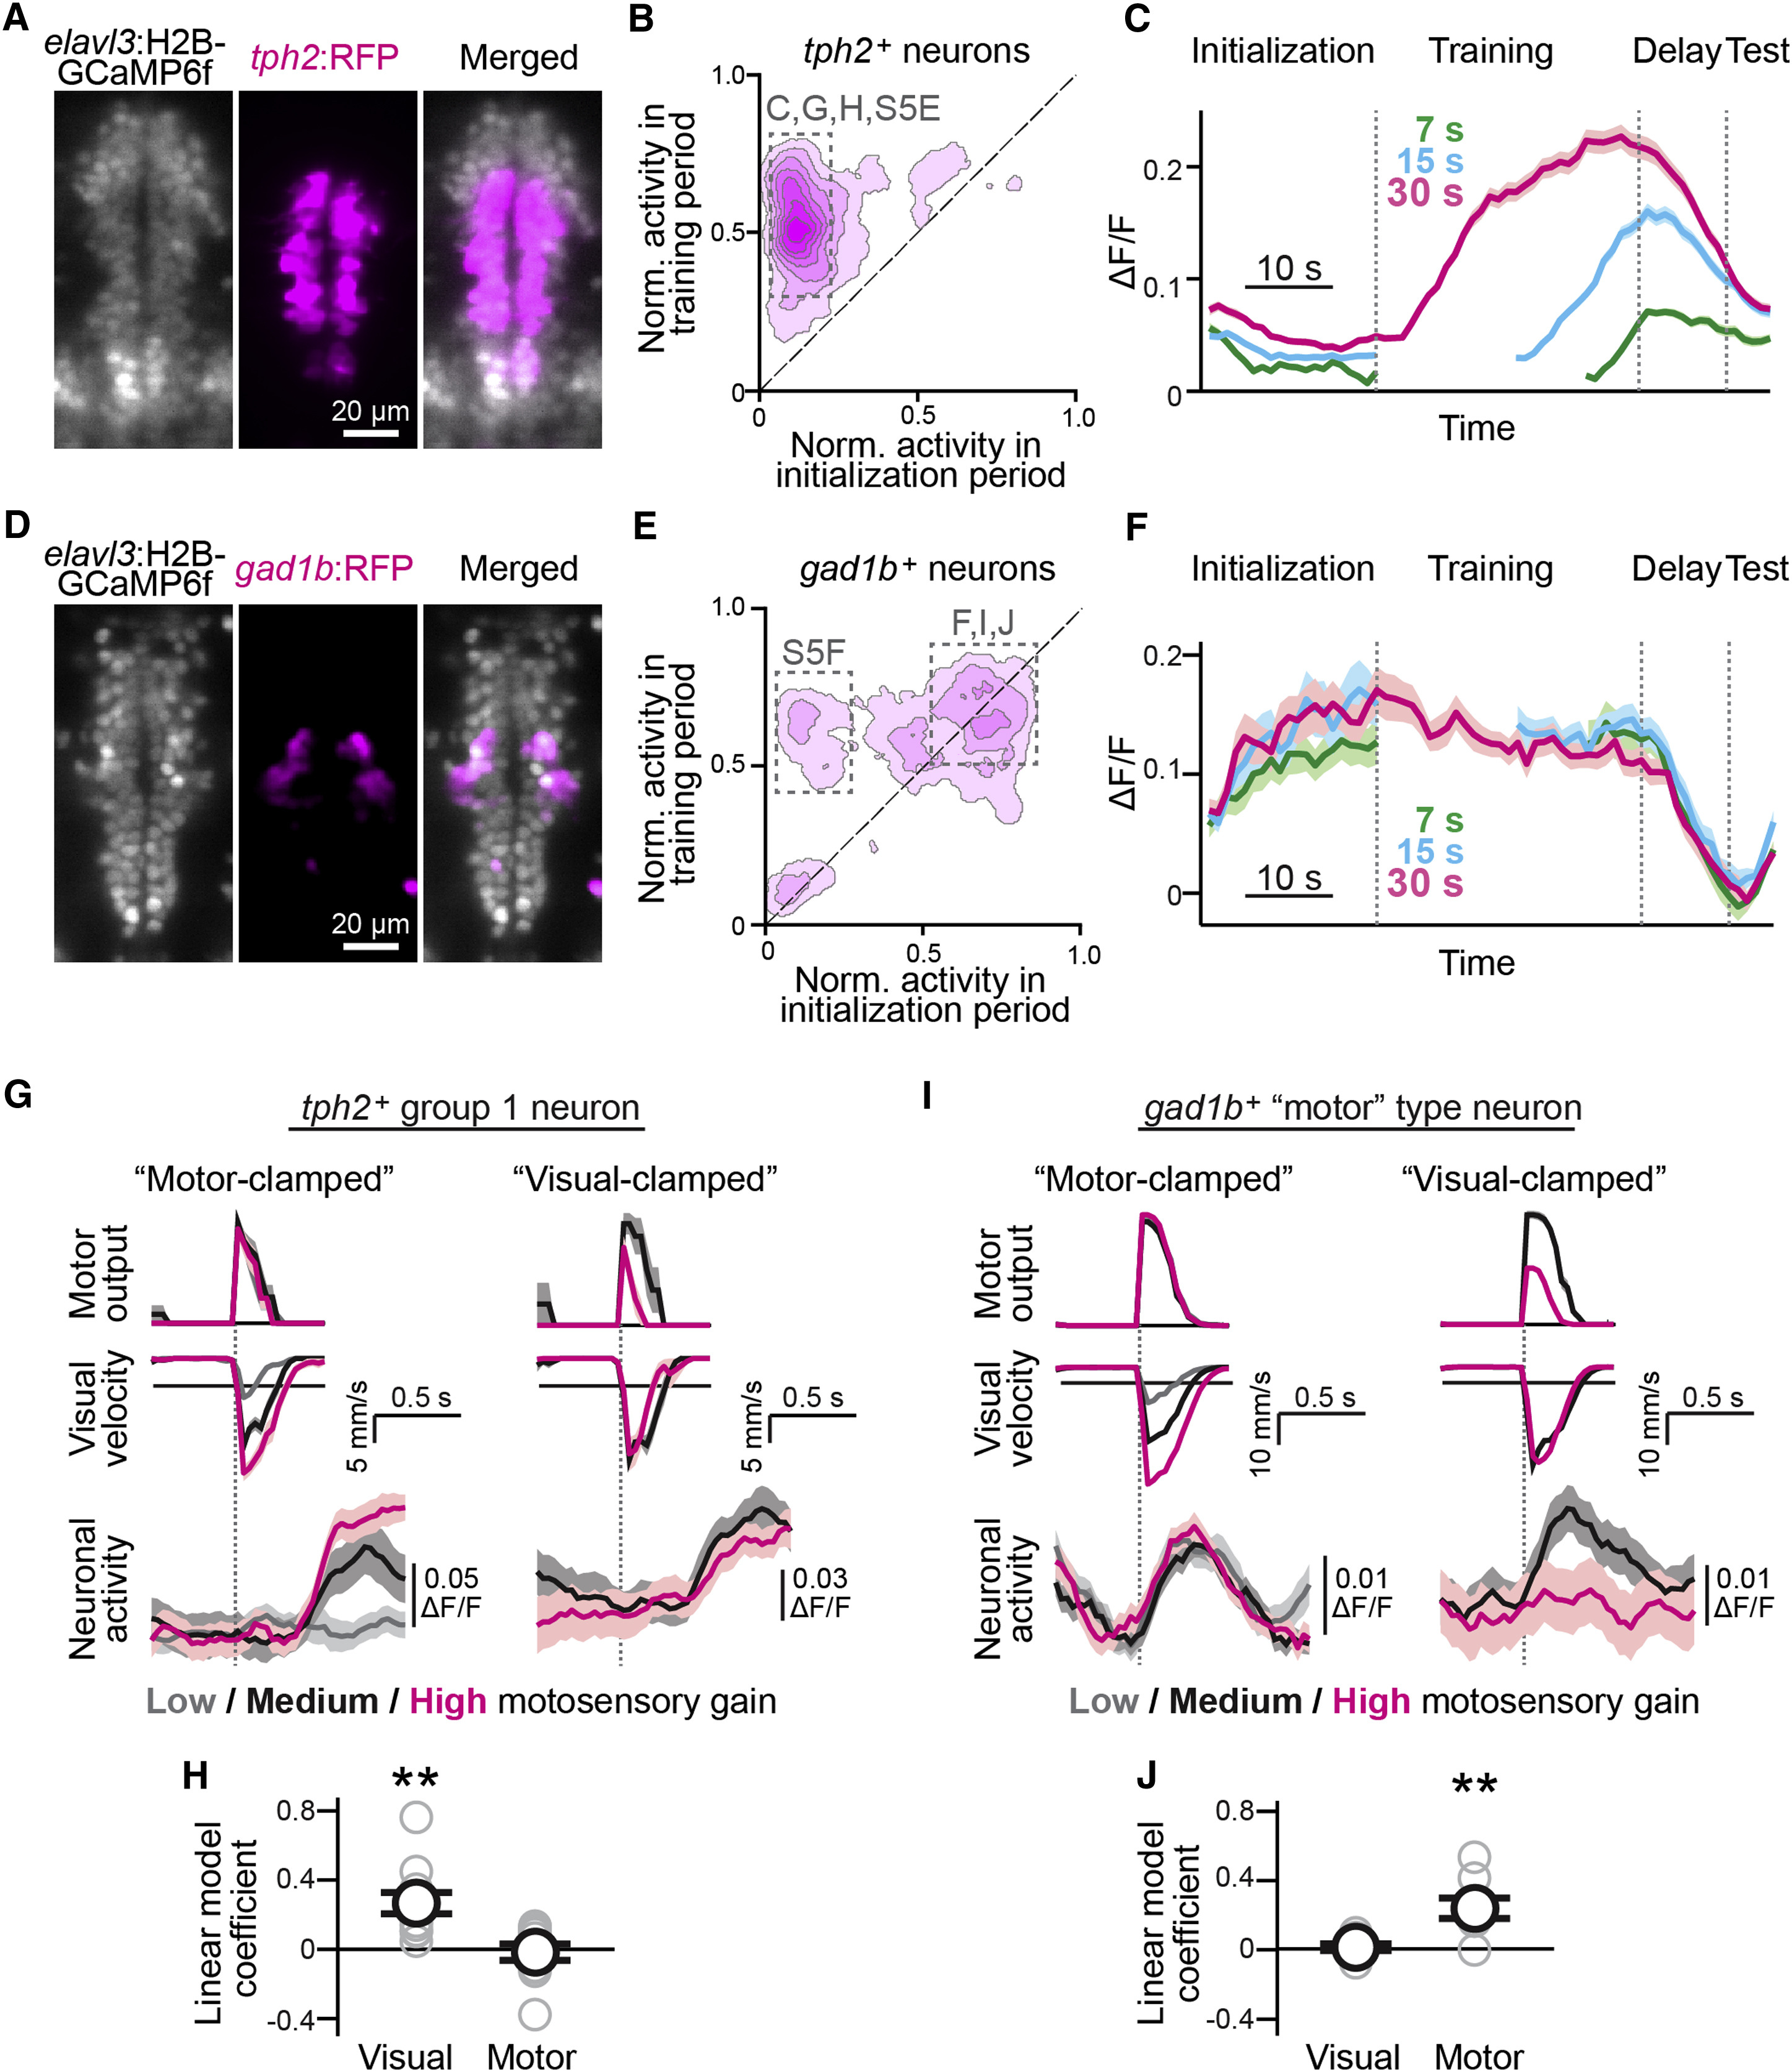
Fig. 5
Cell-Type-Specific DRN Dynamics
(A–C) Dynamics of serotonergic DRN neurons during the motor learning paradigm. (A) Double labeling of DRN neurons with H2B-GCaMP6f (gray) and serotonergic DRN neurons with RFP (magenta). (B) Activity in the initialization and training periods of 420 serotonergic neurons across seven fish, same analysis as in Figure 4A. Activity is higher during training for most neurons. (C) Dynamics of serotonergic neurons during formation and retention of the learning effect of neurons in box C in (B), averaged over 11 trials and across 94 tph2+ DRN neurons in one representative fish. Shadows, SEM across neurons.
(D–F) Dynamics of GABAergic DRN neurons during the motor learning paradigm. (D) Double labeling of DRN neurons with H2B-GCaMP6f (gray) and GABAergic neurons with RFP (magenta). (E) Activity in the initialization and training periods of 356 neurons from nine fish. (F) Dynamics of GABAergic neurons in box F in (E), averaged over 11 trials and across 47 GAD1B+ neurons for one representative fish, showing activation when fish swims (initialization, training, test) and rapid decay when it does not (delay). Shadows, SEM across neurons.
(G–J) Neural activity imaged at 30 Hz during the stochastic gain paradigm of Figure 2C. Sources of population data are indicated by boxes in (B) and (E).
(G) Responses of an example group 1 serotonergic neuron represented by (left) dependence on visual stimulus velocity by motor-clamped analysis as in Figure 2E and (right) dependence on locomotor drive by visual-clamped analysis as in Figure 2F.
(H) Linear model fit to predict response amplitude from swim power and visual input confirms that average responses of serotonergic group 1 neurons are primarily tuned to visual stimulus velocity and less to locomotor drive as in Figures 2E and 2F and consistent with the response profile in (G). ∗∗p = 0.0014 by one-sample t test, 11 fish. Error bars: SEM across fish.
(I) Responses of an example GABAergic motor-type neuron by (left) dependence on visual velocity by motor-clamped analysis as in Figure 2E and (right) dependence on locomotor drive by visual-clamped analysis as in Figure 2F.
(J) Fitting a linear model as in (H) confirms that average responses of GABAergic motor-type neurons are primarily tuned to locomotor drive and less to visual stimulus velocity, consistent with response profile in (I). ∗∗p = 0.0052 by one-sample t test, eight fish. Error bars: SEM across fish.
See also Figure S5.
Reprinted from Cell, 167, Kawashima, T., Zwart, M.F., Yang, C.T., Mensh, B.D., Ahrens, M.B., The Serotonergic System Tracks the Outcomes of Actions to Mediate Short-Term Motor Learning, 933-946.e20, Copyright (2016) with permission from Elsevier. Full text @ Cell