
|
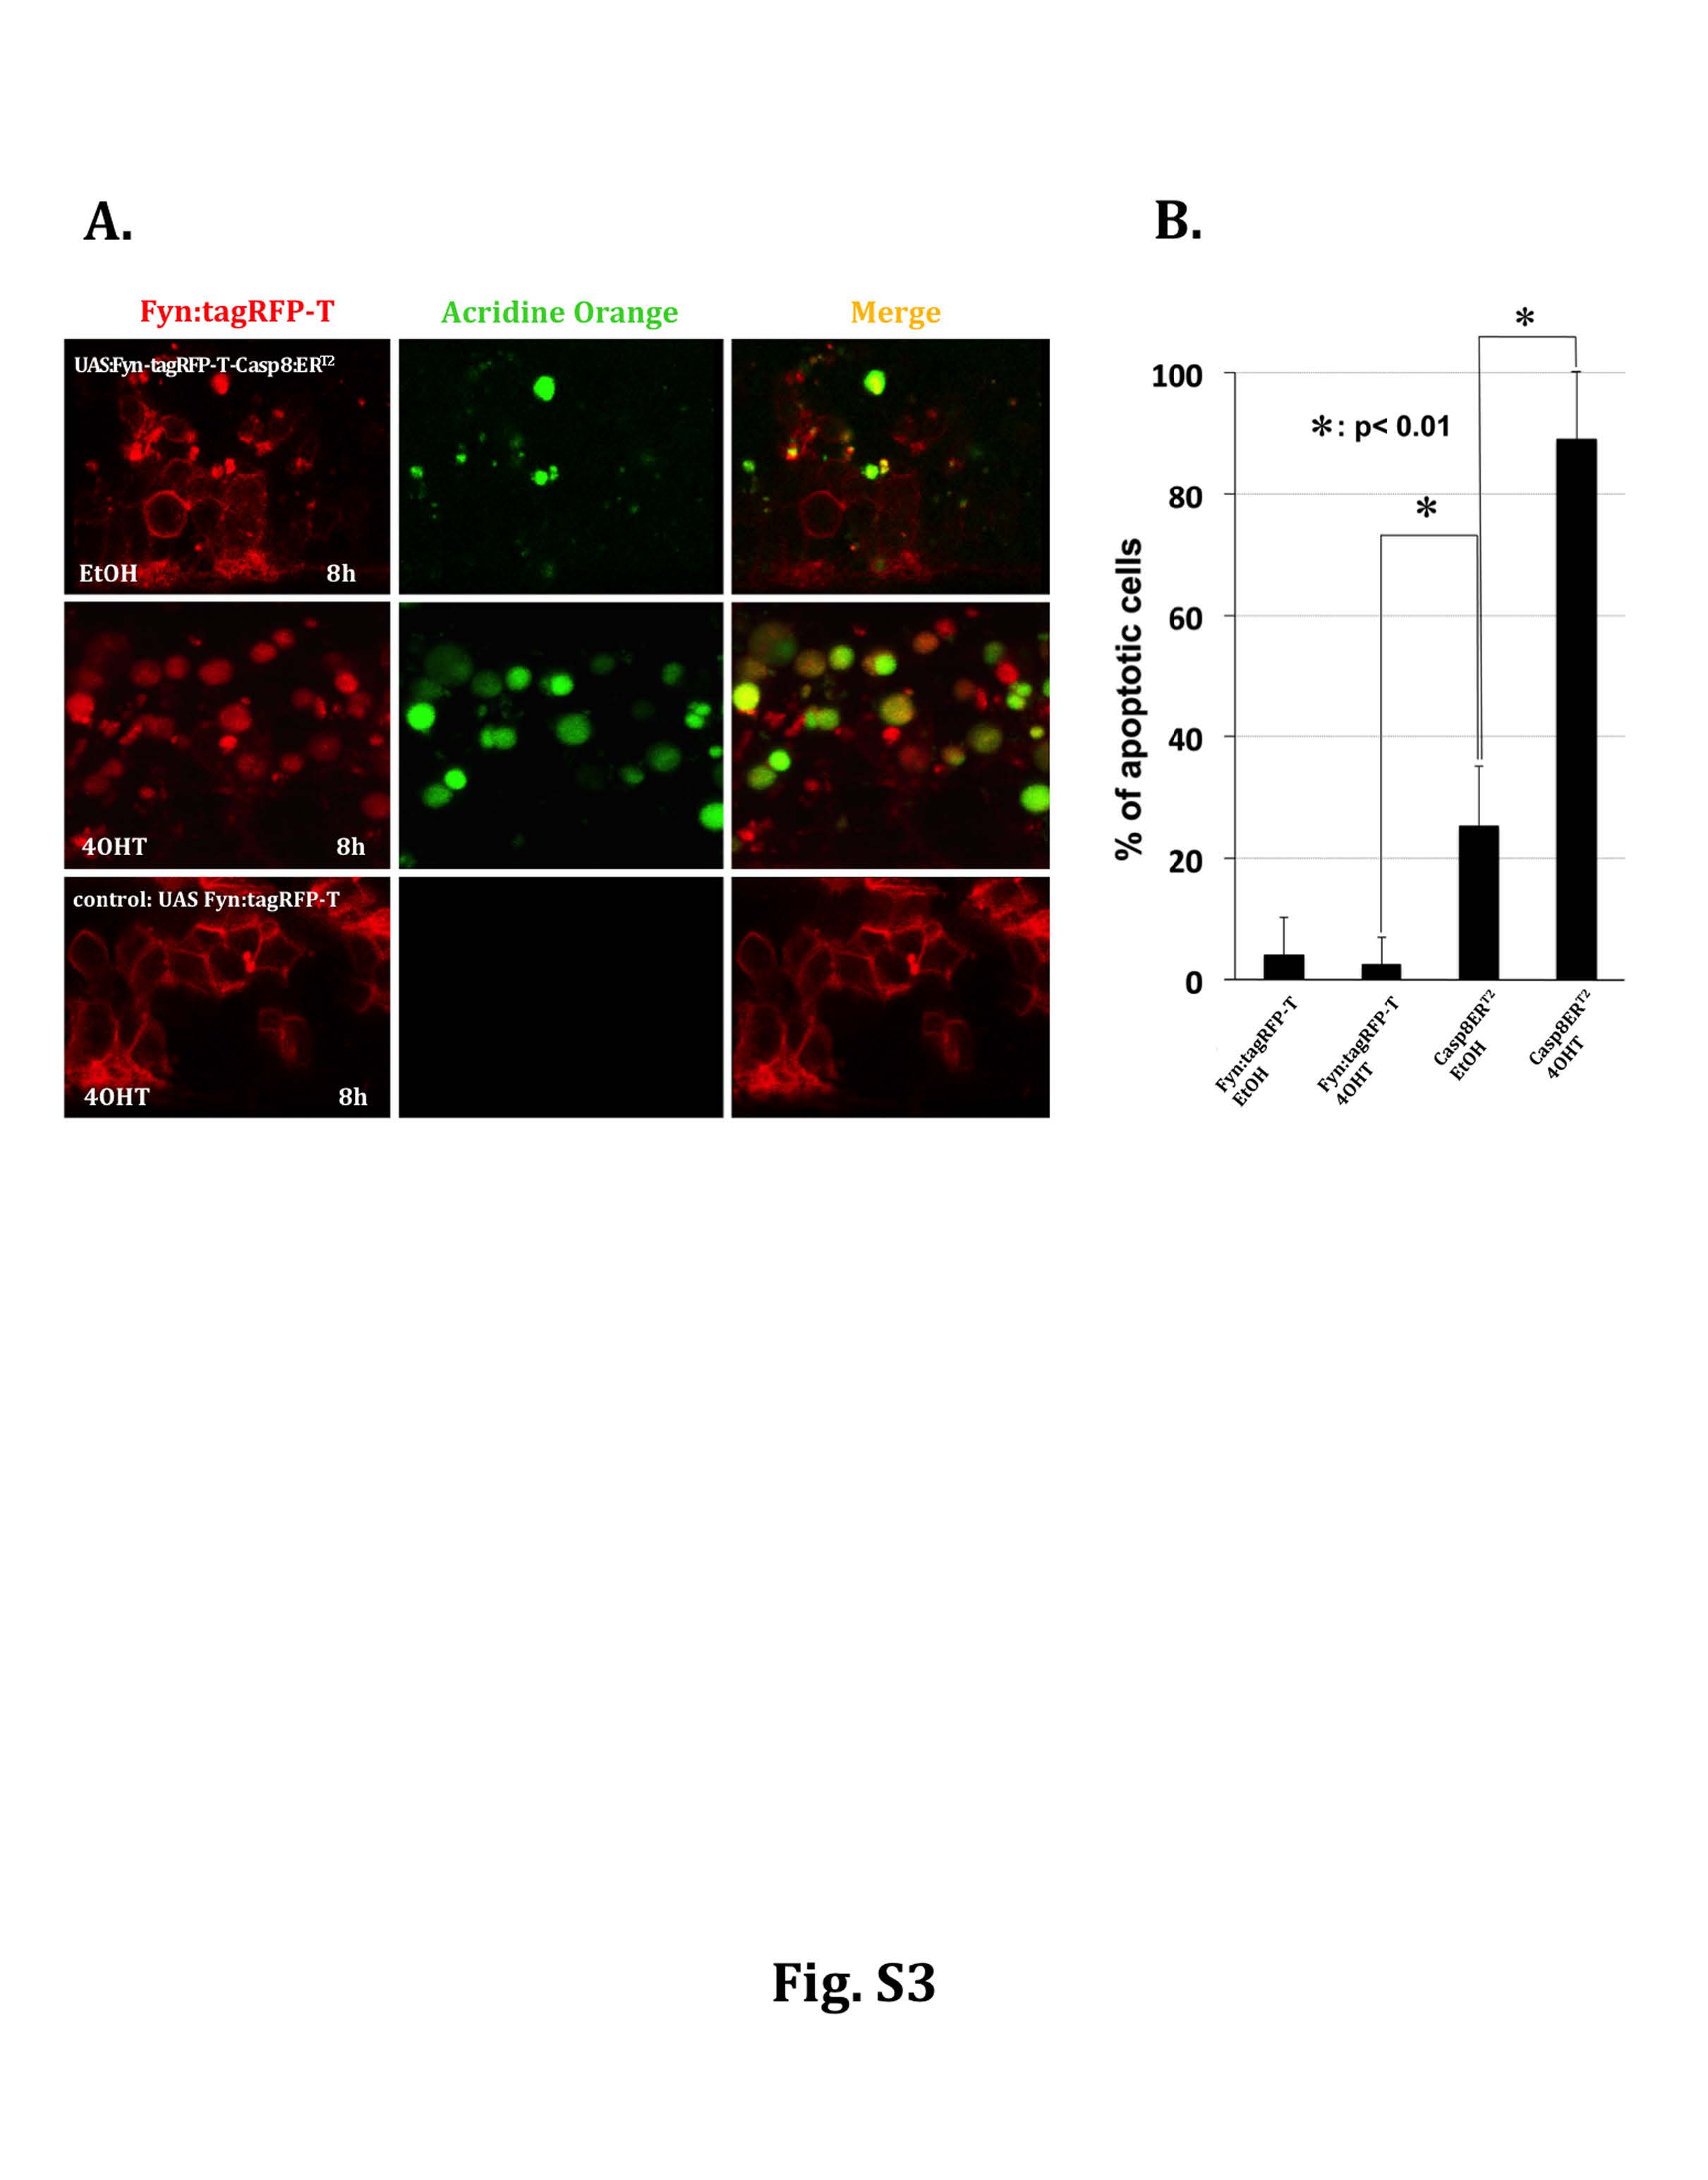
Fig. S3
Quantification of induced apoptosis. (A) Higher magnified images of spinal cord cells expressing FyntagRFP-T/Caspase8ERT2 (upper and middle row in A), and control FyntagRFP-T (lower row). Significant induction of apoptosis was observed in almost all FyntagRFP-T expressing cells 8 hours after 4OHT treatment (middle). Compared to control embryos expressing only FyntagRFP-T with virtually no apoptotoc cells (lower row), FyntagRFP-T/Caspase8ERT2 -injected embryos treated with EtOH displayed an increased level of apoptosis (upper row) but clearly to a lesser extend than 4OHT treated embryos. (B) Quantification of the percentage of these apoptotic cells was performed by calculating the number of acridine orange/ tagRFP-T double positive cells relative to all tagRFP-T positive cells. Cells were counted on confocal z-stack images through the spinal cord from 5 independent embryos each. * <0.01 : p value is lower than 0.01 by Student´s t-test.