
|
Fig. 1 S1
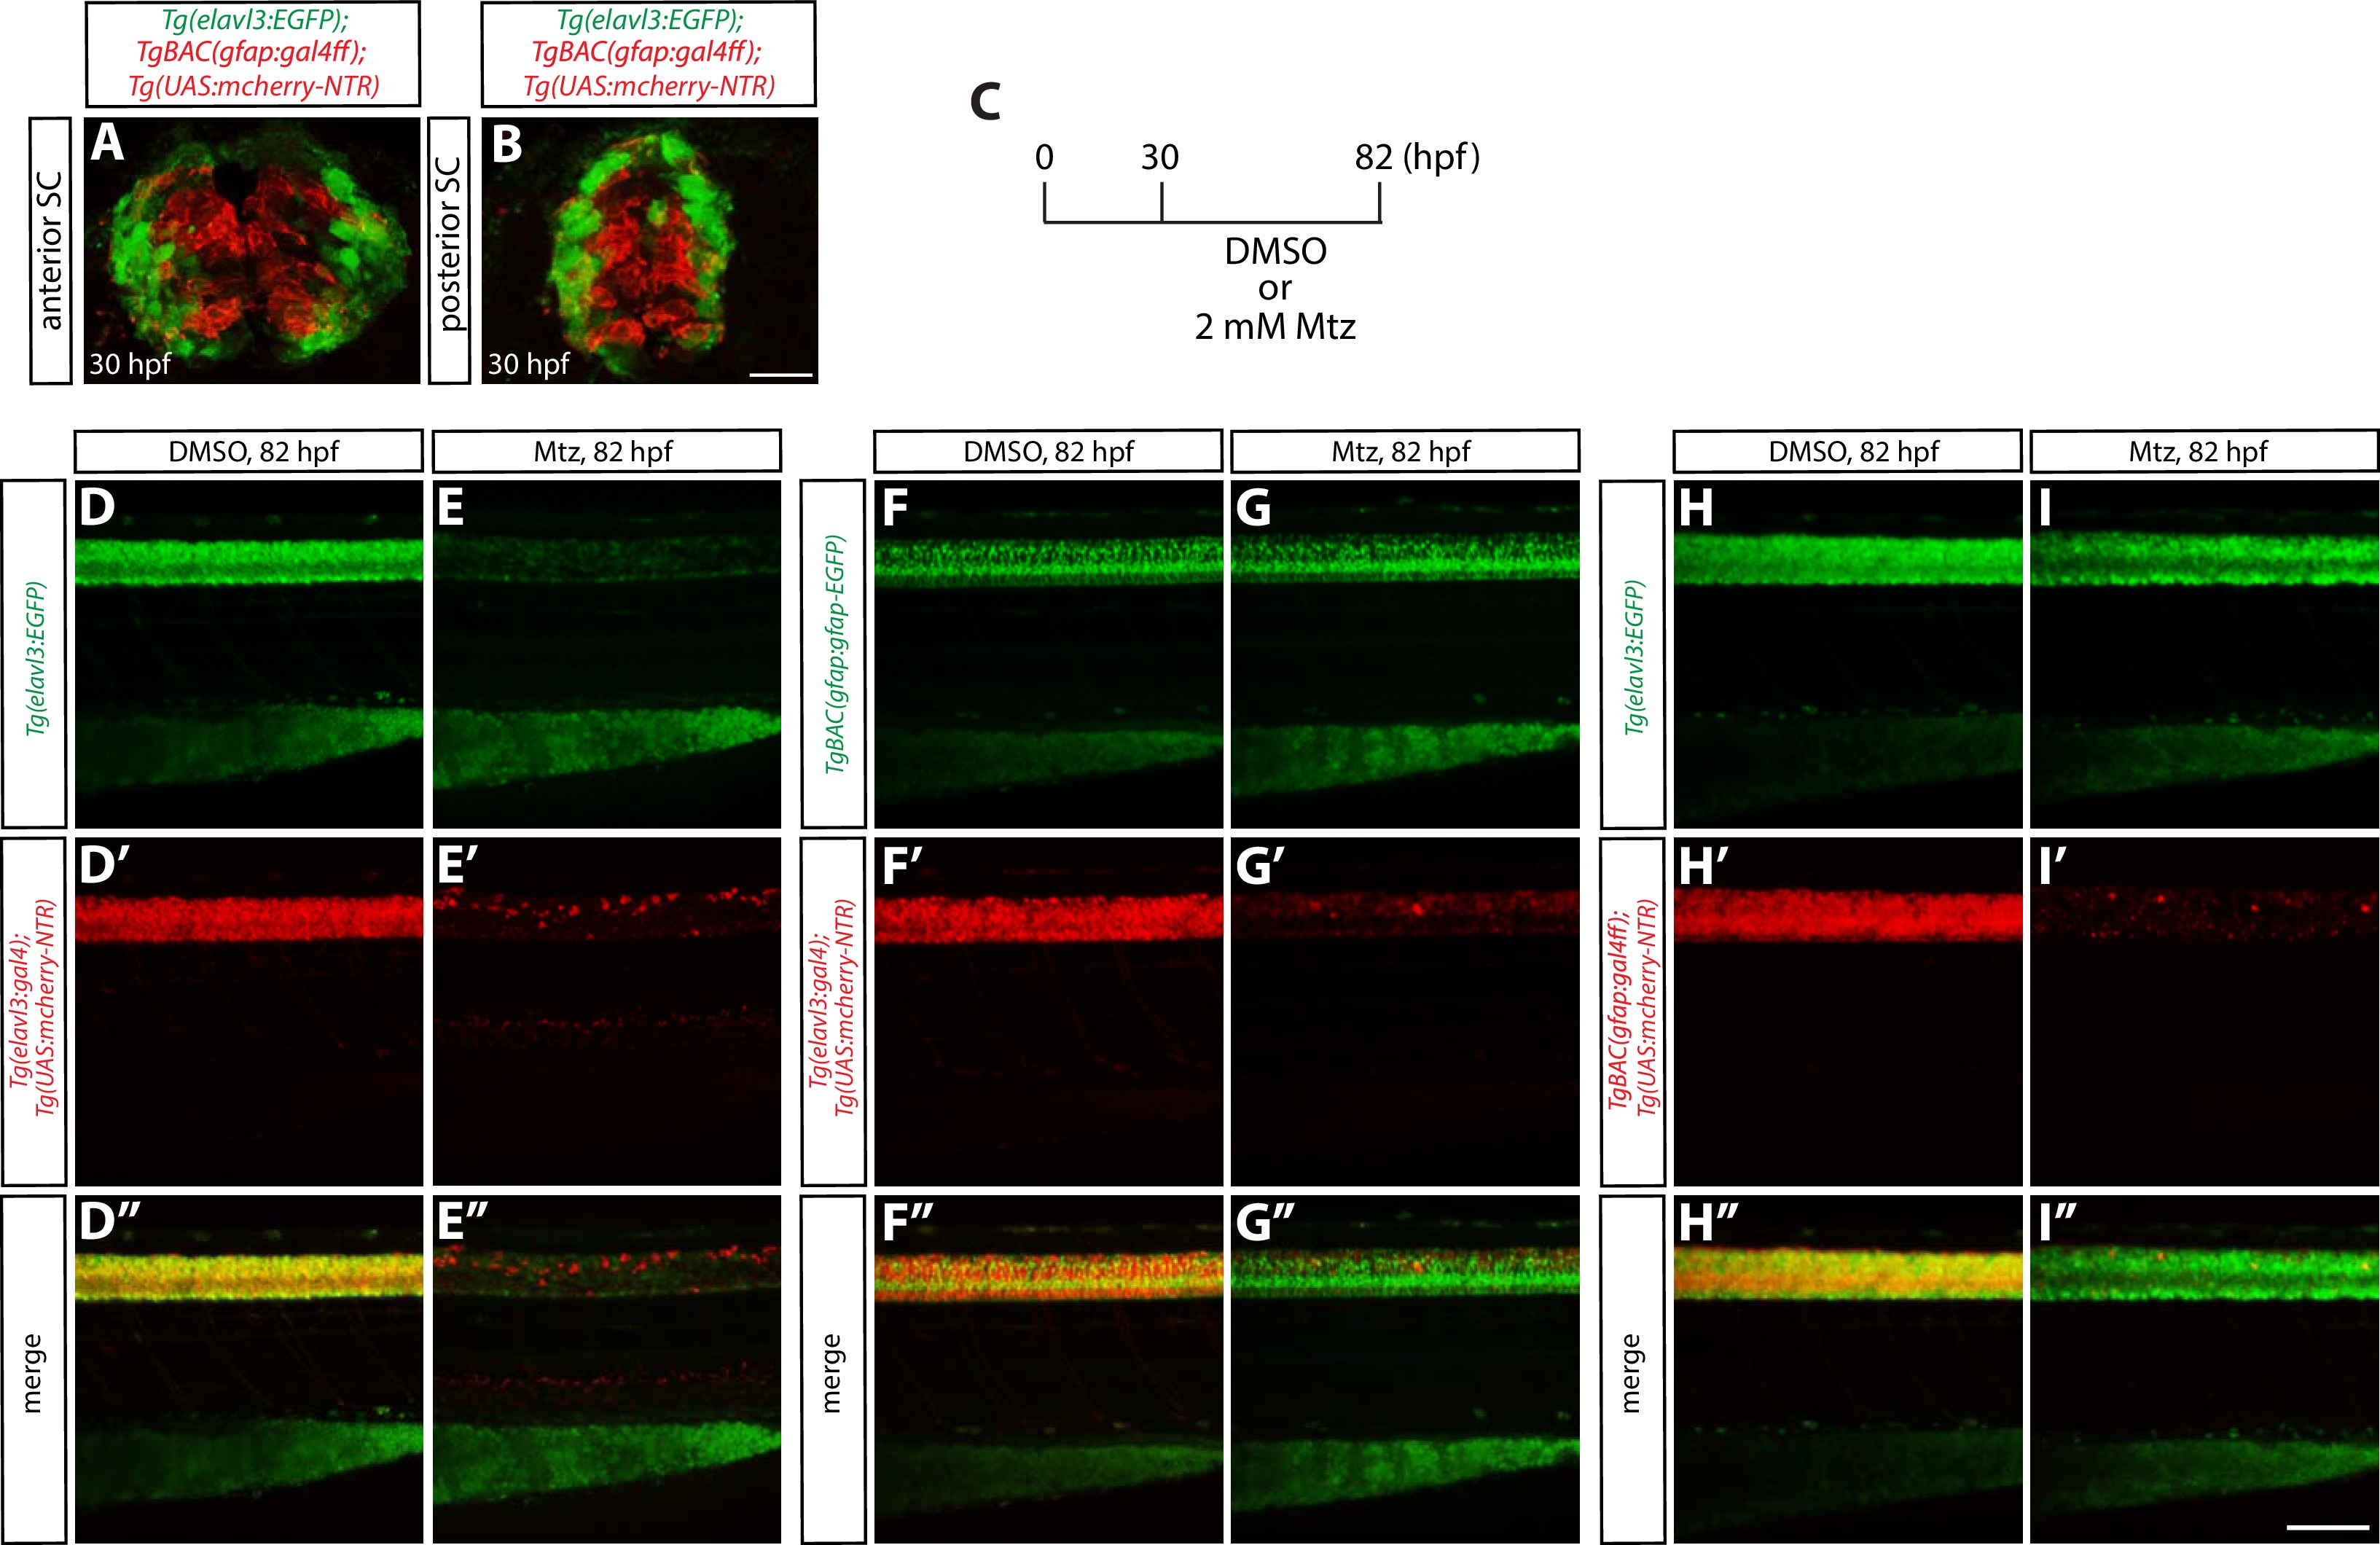
Characterization of radial glia or neuronal ablation by the NTR/Mtz-mediated cell ablation method.
(A and B) 30 hpf Tg(elavl3:EGFP);TgBAC(gfap:gal4ff);Tg(UAS:mcherry-NTR) trunk sections at the level of the anterior (A) or posterior (B) SC. EGFP+ neurons and mCherry+ radial glia are largely segregated. Scale bar, 20 µm. (C) Experimental time course of NTR/Mtz-mediated ablation for the panels (D–I”). (D–D” and E–E”) 82 hpf Tg(elavl3:EGFP);Tg(elavl3:gal4);Tg(UAS:mcherry-NTR) trunks after treatment with DMSO (D–D”) or 2 mM Mtz (E–E”) starting at 30 hpf. Unlike DMSO-treated fish that show strong co-expression of Tg(elavl3:EGFP) and Tg(elavl3:gal4);Tg(UAS:mCherry-NTR) in their spinal cord, Mtz-treated fish show a dramatic reduction of this co-expression. (F–F” and G–G”) 82 hpf TgBAC(gfap:gfap-EGFP);Tg(elavl3:gal4);Tg(UAS:mcherry-NTR) trunks after treatment with DMSO (F–F”) or 2 mM Mtz (G–G”) starting at 30 hpf. Mtz-treated fish show a dramatic reduction of Tg(elavl3:gal4);Tg(UAS:mCherry-NTR) expression in their spinal cord, however, TgBAC(gfap:Gfap-EGFP) expression appears unaffected as compared to DMSO-treated fish. (H–H” and I–I”) 82 hpf Tg(elavl3:EGFP);TgBAC(gfap:gal4ff);Tg(UAS:mcherry-NTR) trunks after treatment with DMSO (H–H”) or 2 mM Mtz (I–I”) starting at 30 hpf. Mtz-treated fish show a dramatic reduction of TgBAC(gfap:gal4ff);Tg(UAS:mCherry-NTR) expression in their spinal cord, and Tg(elavl3:EGFP) expression is also slightly reduced as compared to DMSO-treated fish that show strong expression of both TgBAC(gfap:gal4ff);Tg(UAS:mCherry-NTR) and Tg(elavl3:EGFP) expression in their spinal cord. Scale bar, 100 µm.