
|
Fig. 6 S2
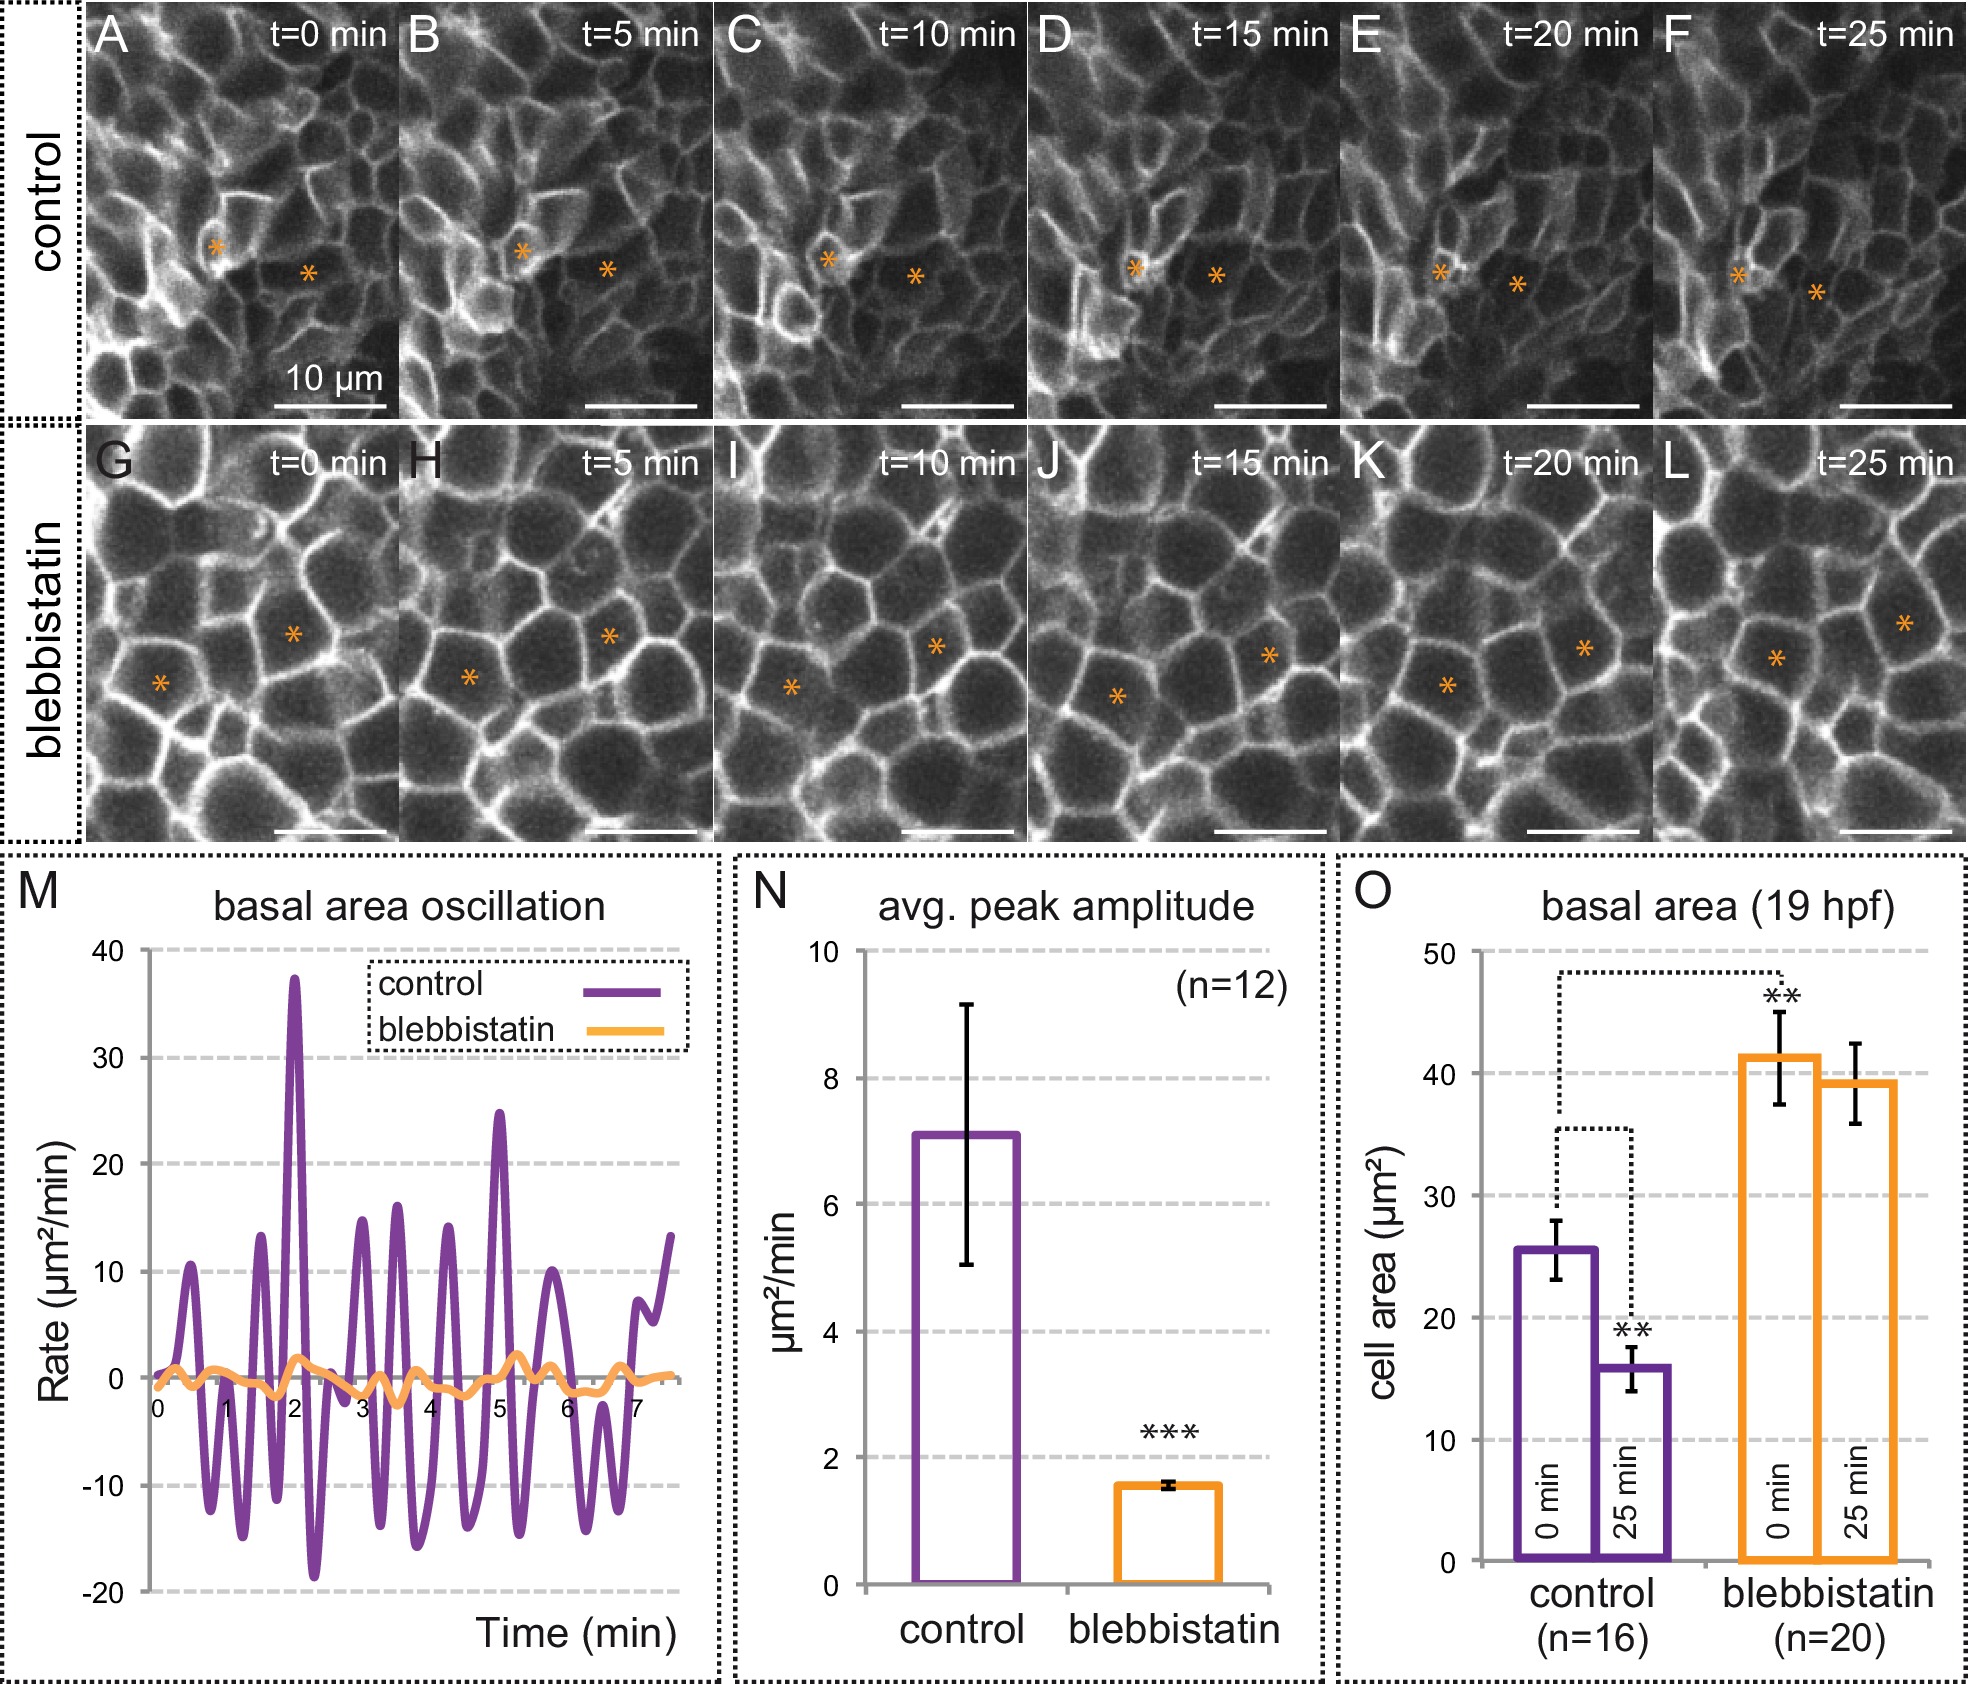
Myosin inhibition impairs basal constriction.
(A–L) Live-imaging analysis of cell area dynamics in control (A–F) and blebbistatin-treated (G–L) tg(vsx2.2:GFP-caax) embryos. Progressive constriction is observed in individual cells (asterisk) in control, but not in blebbistatin-treated tissue. (M) Basal area variation rate is shown for representative control and blebbistatin-treated cells. (N) Average peak amplitude of the cell area rate is considerably reduced in treated cells (T-test, n = 12). (O) Blebbistatin treatment significantly inhibited basal constriction over a considered period of 25 min, blocking the cells in a relaxed state (T-test). Scale bars = 10 µm.