
|
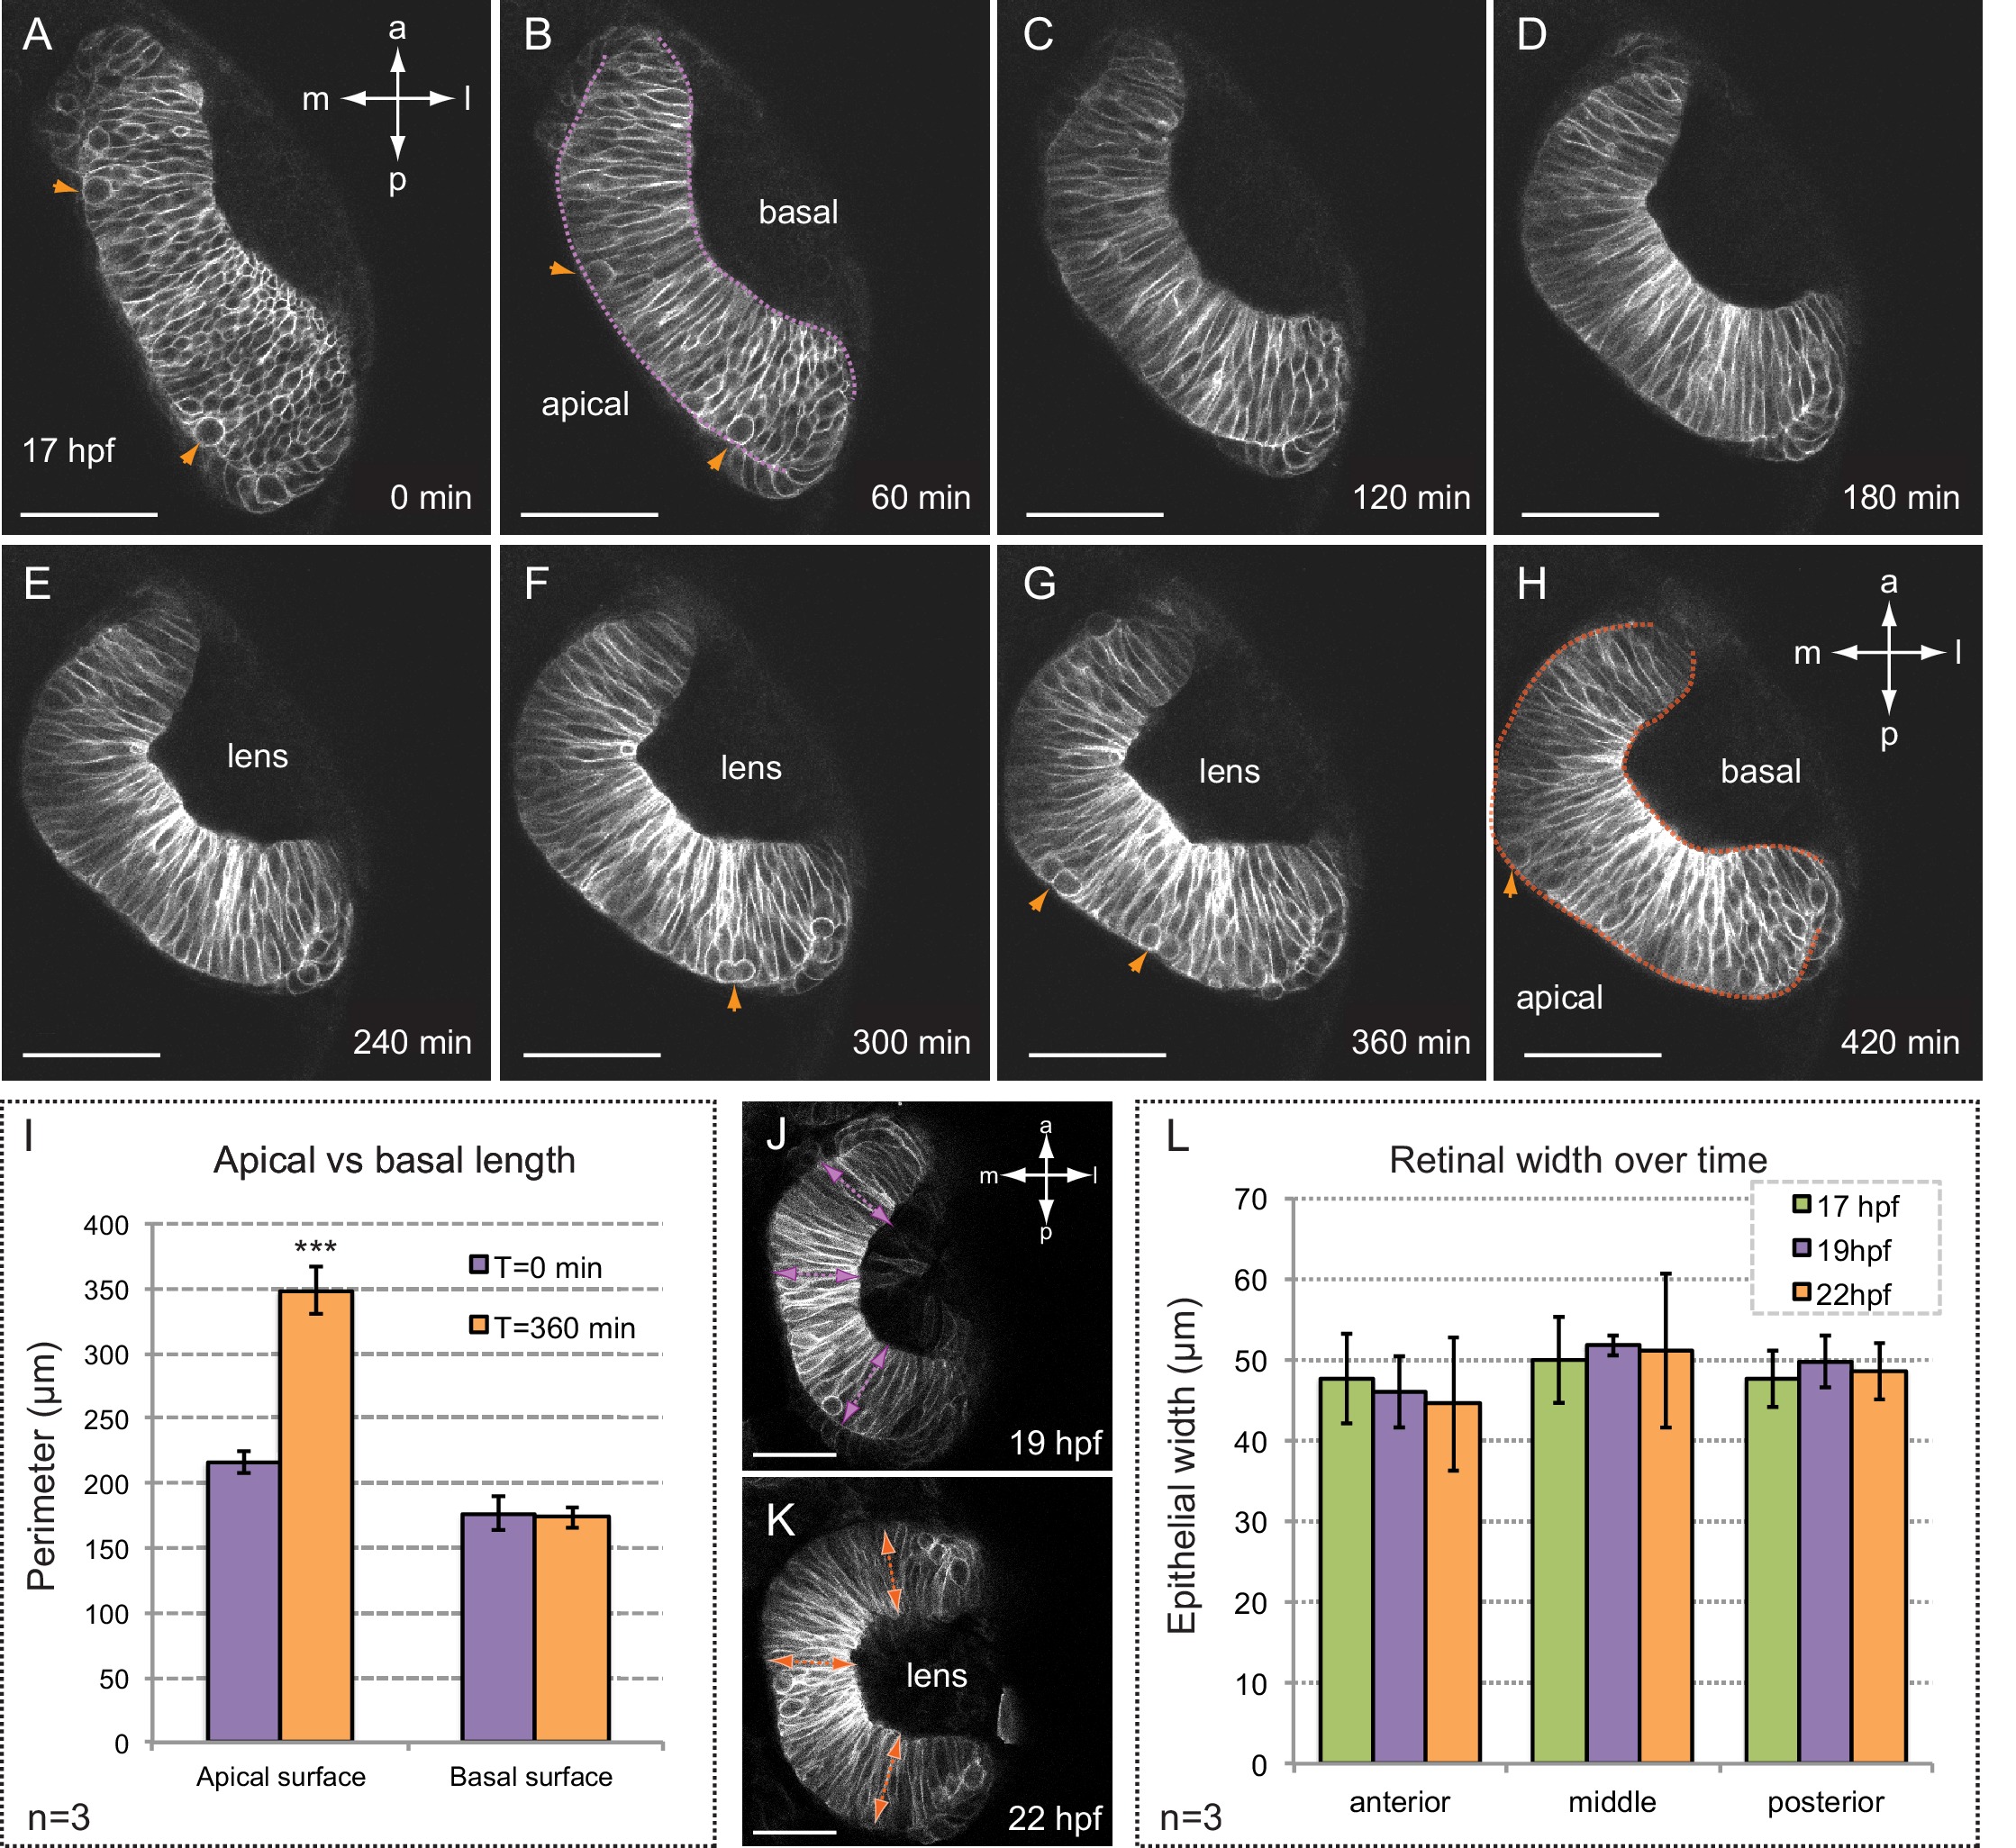
Fig. 1
Folding of the retinal epithelium in zebrafish.
(A–H) Time series of optical sections show the progression of retinal morphogenesis starting at 17 hpf (dorsal view) in a tg(vsx2.2:GFP-caax) embryo. Arrowheads point to mitotic divisions at the apical surface. Apical and basal edges are indicated at 60 (purple) and 420 (orange) min. See also Video 1. (I) Quantification of the perimeter of the apical and basal edges between 18 and 24 hpf. (J–L) Retinal width remains constant throughout retinal folding as revealed in tg(vsx2.2:GFP-caax) embryos. Error bars indicate s.d. of the mean. (n = 3; T-test). Antero-posterior and medio-lateral axes are indicated. Scale bars = 50 µm.