
|
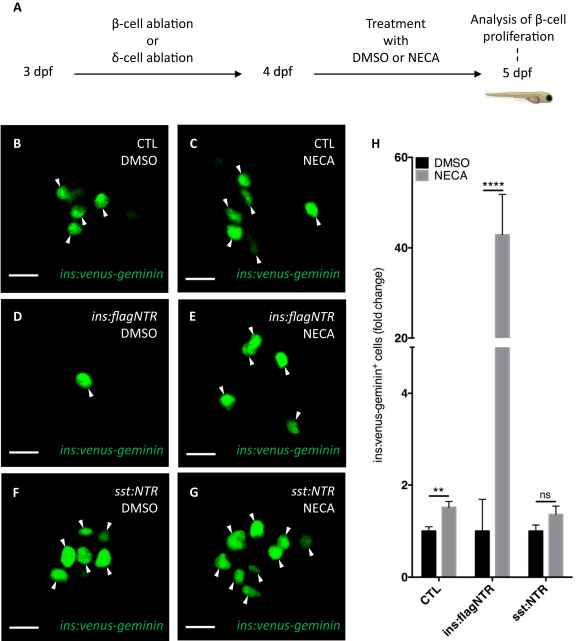
Fig. 1
Pharmacological activation of adenosine signaling promotes β-cell proliferation independently of an apoptotic microenvironment. (A) Schema of the analysis of β-cell proliferation in control zebrafish larvae and larvae subjected to β-cell ablation or δ-cell ablation. Ablation was carried out by exposing the nitroreductase (NTR)-expressing transgenics to metronidazole (MTZ) from 3 to 4 days post fertilization (dpf). Islets were analyzed by confocal microscopy at 5 dpf. (B–G) Representative pictures of proliferating β-cells (arrowheads) in islets of Tg(ins:venus-geminin) zebrafish treated with DMSO or NECA from 4 to 5 dpf in the presence or absence of β-cell ablation (D–E) or δ-cell ablation (F–G). β-cell ablation was achieved by crossing the Tg(ins:venus-geminin) zebrafish with Tg(ins:flag-NTR) zebrafish and treating them with MTZ; δ-cell ablation by crossing them with Tg(sst:NTR) zebrafish and treating them with MTZ. (H) β-cell proliferation in the absence of cell ablation (CTL), and after β-cell or δ-cell ablation. Each condition was normalized (DMSO = 1), allowing comparison of fold changes. Absolute numbers are shown in Figure S1. n = 13–32; scale bars: 10 μm; **p < 0.01; ****p < 0.0001.