
|
Fig. 4
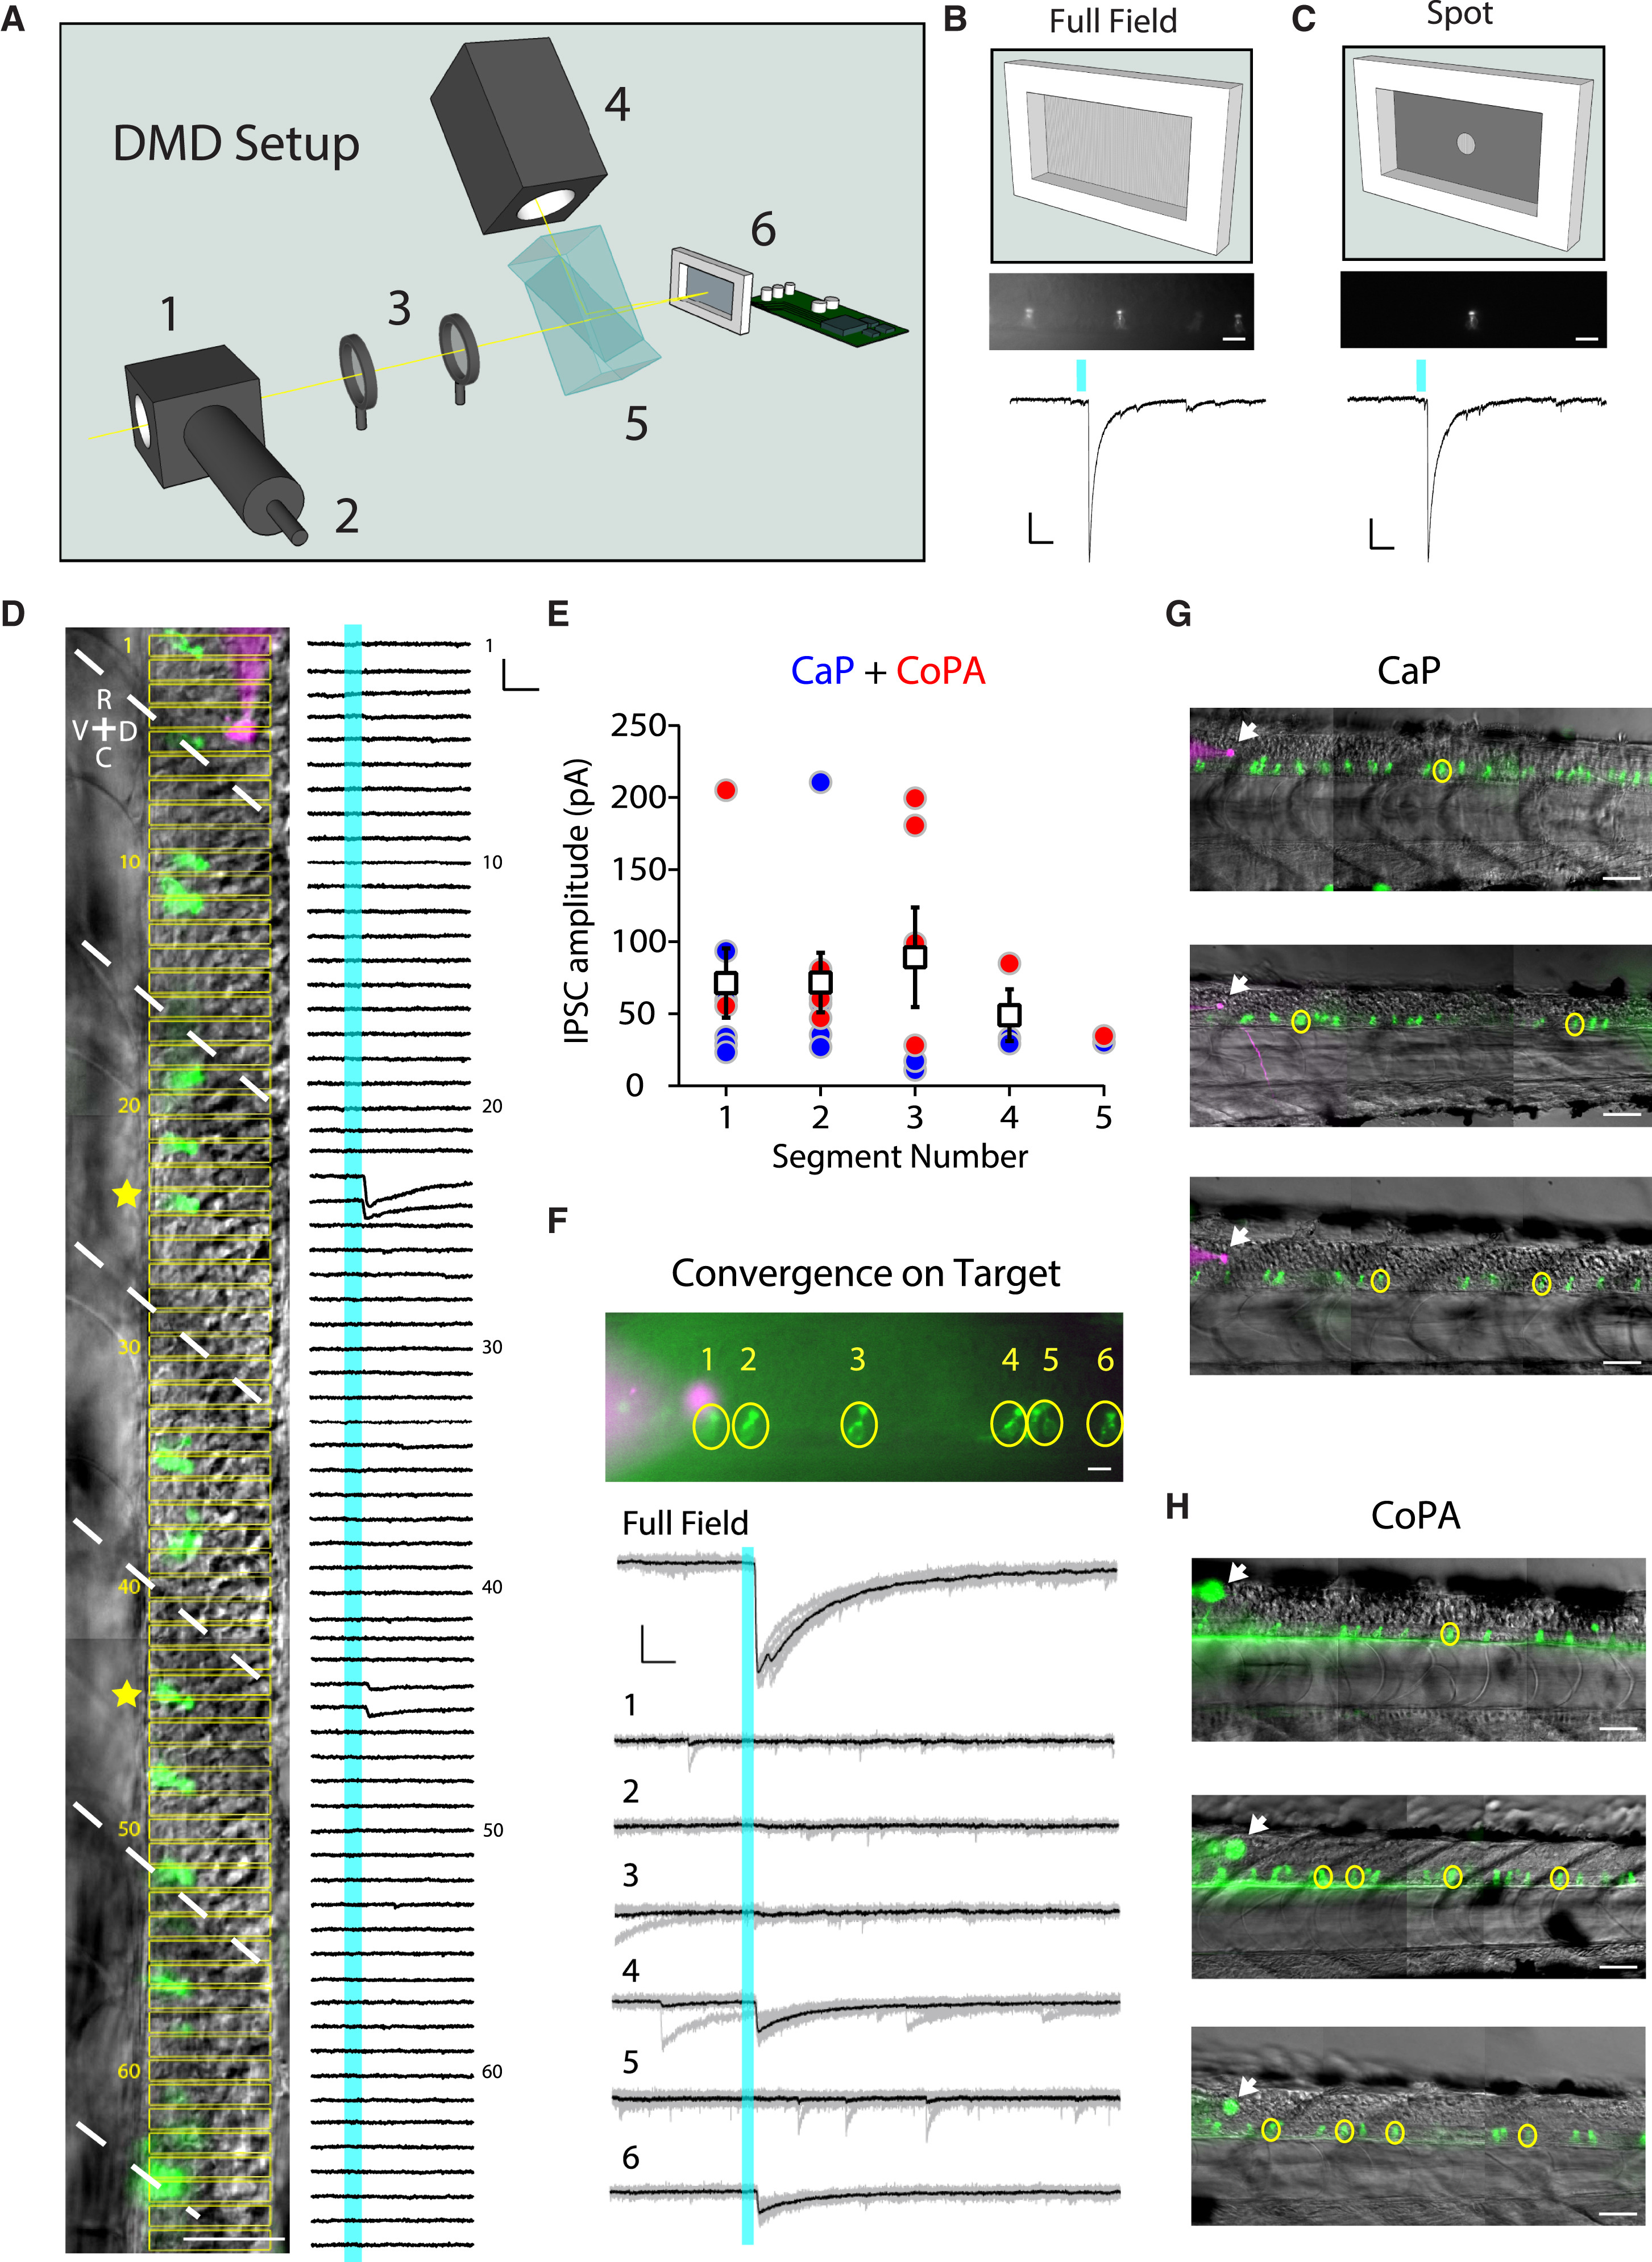
2D Light Patterning at Single-Cell Resolution Reveals Convergence of Inputs from CSF-cNs onto Their Targets
(A) Schematic of the digital mirror device (DMD) setup showing the light path. A beamsplitter (1) was attached to the epi-port of an upright microscope in order to combine light from the epifluorescence light source via an optical fiber (2) and the light from the DMD. The patterned light from the DMD was relayed into the epifluorescence light path via a telescope (3). A white light-emitting diode (LED) (4) providing the light for patterned illumination was directed via a total internal reflection prism (5) to the DMD (6).
(B and C) Physiological responses to either full-field illumination (B) or a small spot on an individual CSF-cN (C). Top: fluorescent image of multiple CSF-cNs from the Tg(pkd2l1:gal4; UAS:ChR2-mCherry) transgenic line with all (B) or a subset of the central mirrors activated (C). Scale bars, 20 μm. Bottom: IPSCs following a 5-ms light pulse from either full-field (B) or patterned illumination (C). In cases where only one CSF-cN is connected to the target, the IPSC amplitude evoked by the spot recapitulates the IPSC amplitude evoked by the full-field illumination. Scale bars, 50 ms horizontal and 20 pA vertical.
(D) Example experiment investigating the connectivity from CSF-cNs (green) to a CaP motor neuron (magenta) showing multiple CSF-cNs projecting onto the postsynaptic target. Light was patterned in rectangles (indicated in yellow), which were sequentially illuminated along the rostro-caudal axis during voltage-clamp recording of the target neuron. Right: voltage-clamp traces resulting from the light activation of the corresponding rectangular region. IPSCs are observed when the light is patterned onto a subset of CSF-cNs (yellow stars). White dashed lines indicate segment boundaries. Scale bars, 50 μm (image) and 10 ms horizontal and 50 pA vertical (electrophysiological traces).
(E) Quantification of the IPSC amplitude for CaP (blue circles) and CoPA (red circles) as a function of the number of segments between a CSF-cN and its target. Mean IPSC amplitude for CaP and CoPA combined is plotted for each segment (white boxes).
(F) Convergence of CSF-cNs onto a CaP motor neuron. Image of CSF-cNs expressing ChR2-mCherry (green) and the target CaP motor neuron filled with Alexa dye (magenta). IPSCs in response to either full-field or patterned illumination show that cells “4” and “6” converge onto the CaP motor neuron target.
(G and H) Examples of identified connections from CSF-cNs to CaP motor neurons (G) and CoPA neurons (H) in three different larvae. Arrows indicate the patched target cell body. Yellow circles show connected CSF-cNs. Scale bars, 50 μm.
See also Table S1.