
|
Fig. 3
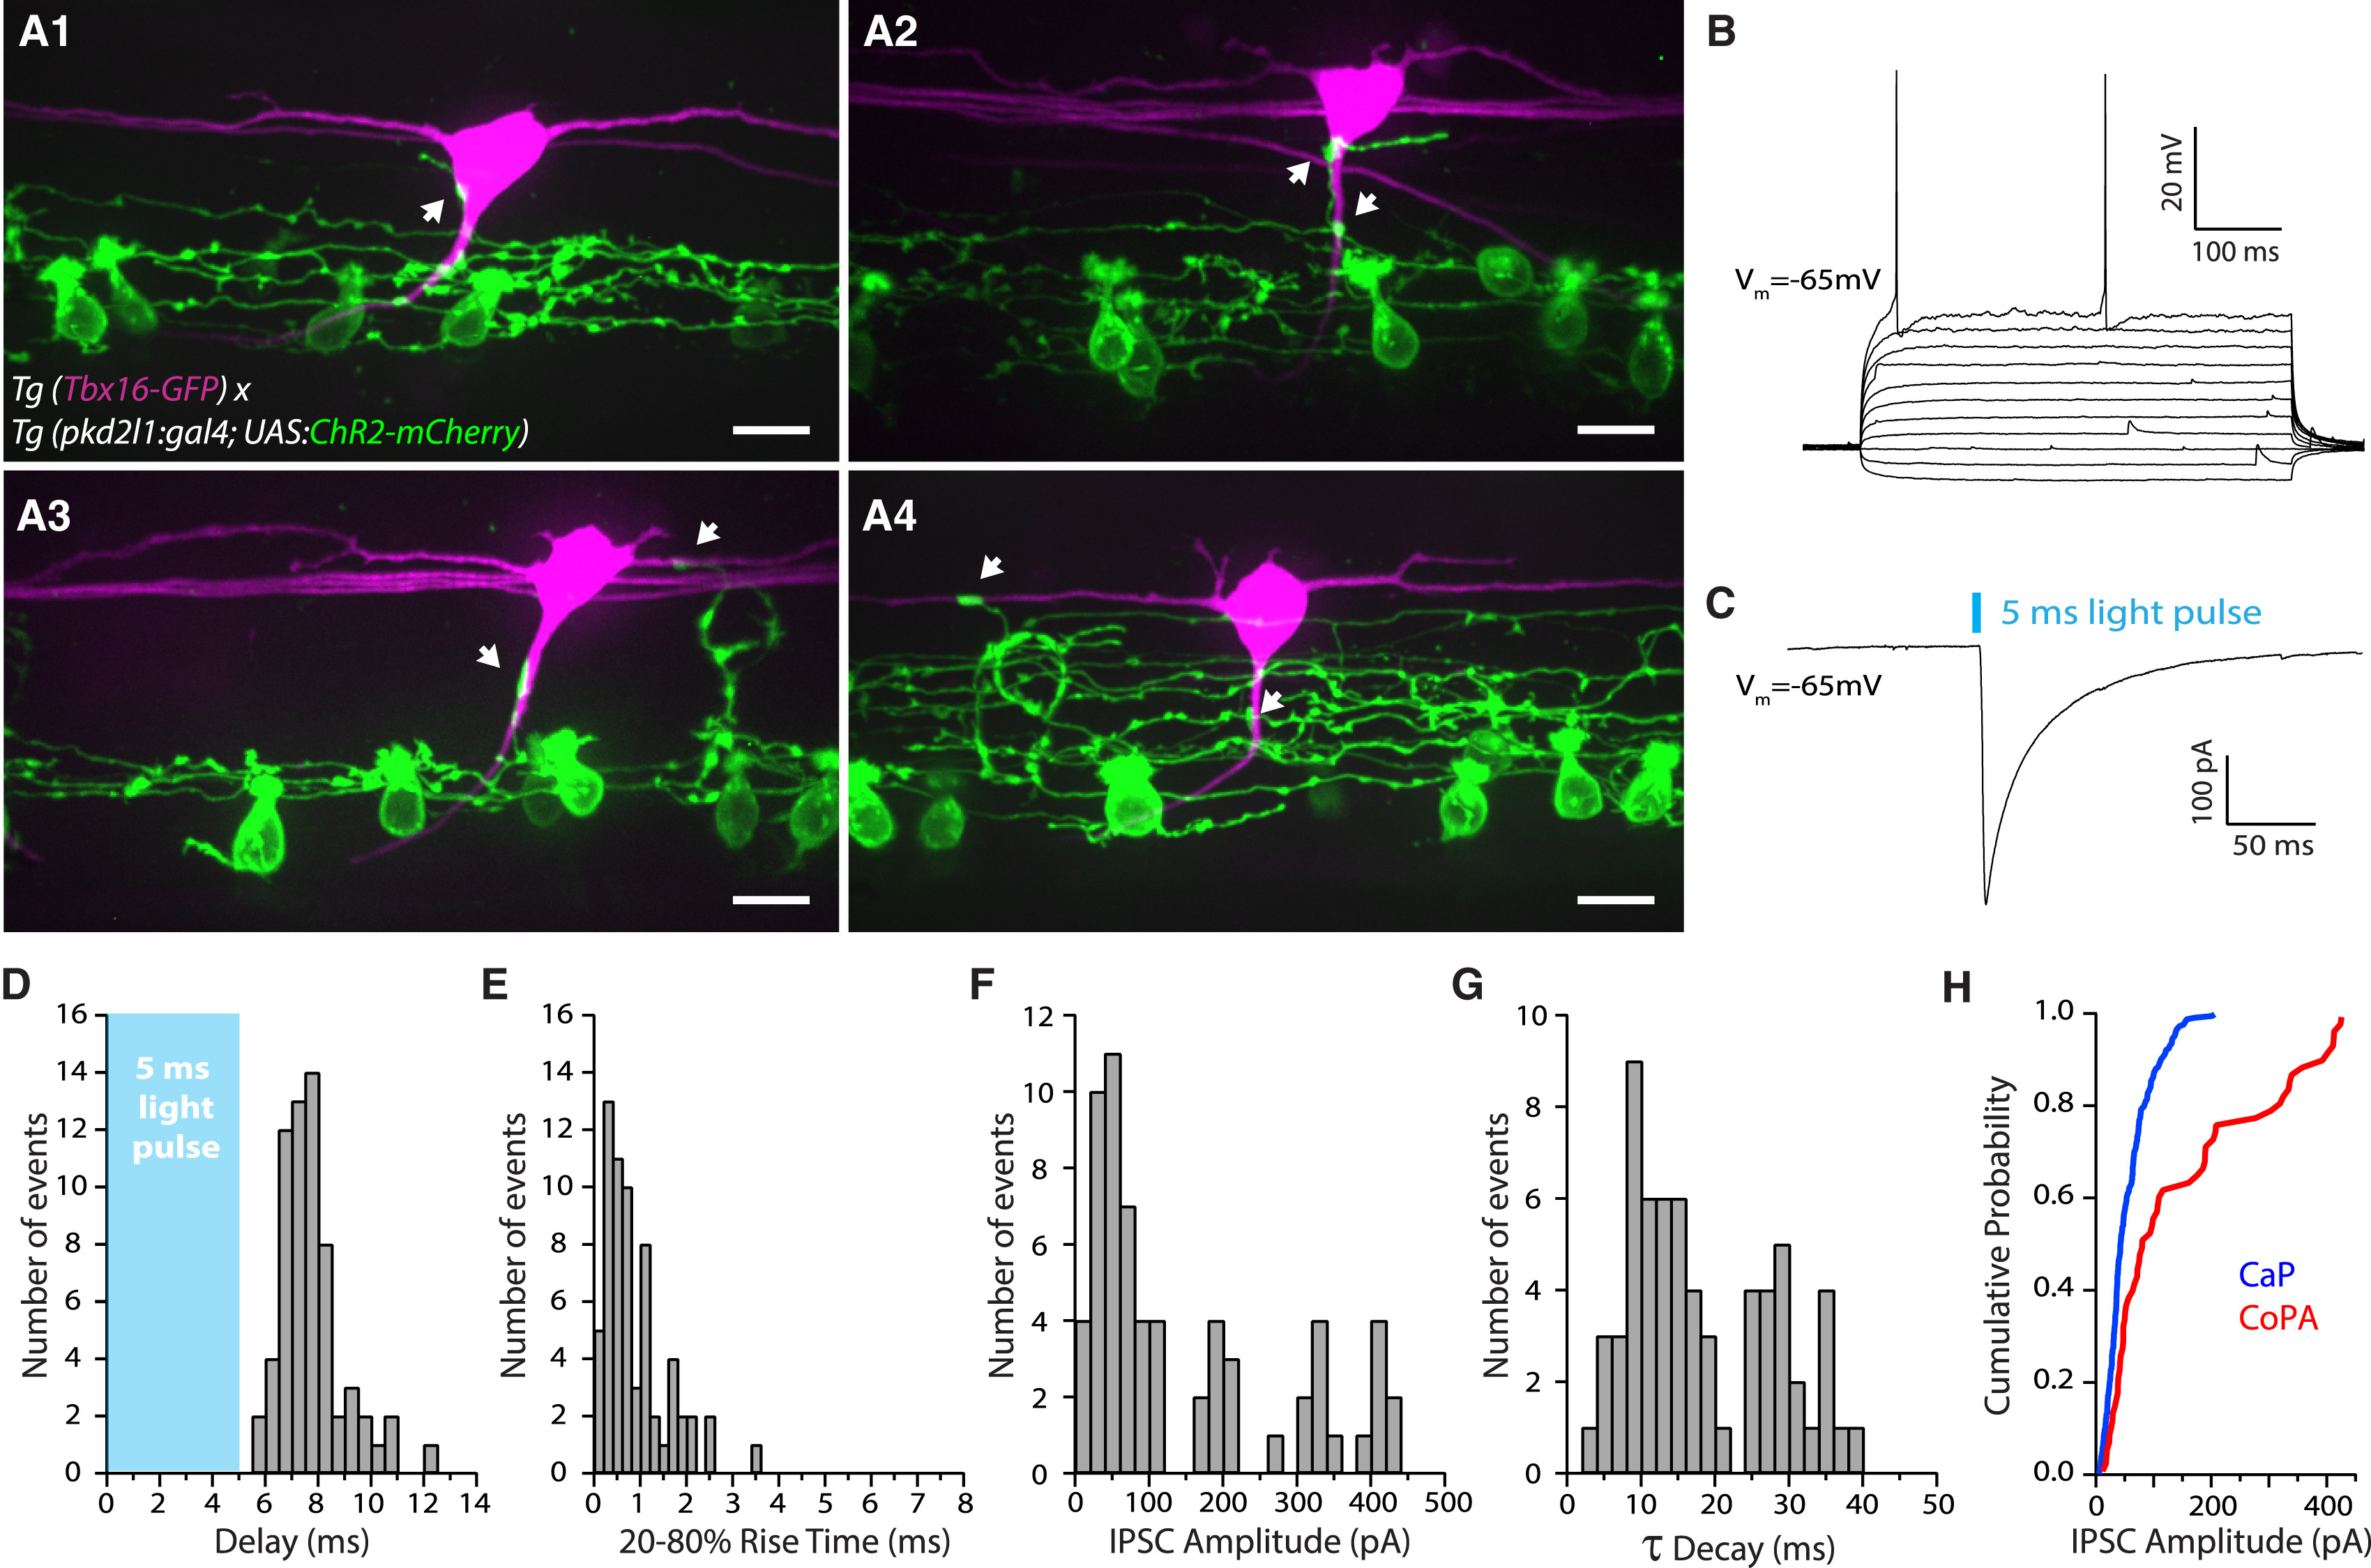
CSF-cNs Innervate CoPA Glutamatergic Sensory Interneurons
(A1–A4) Z projection stack showing CoPA sensory interneurons expressing GFP (magenta) innervated by CSF-cNs (green) in Tg(pkd2l1:gal4; UAS:ChR2-mCherry; tbx16:GFP) transgenic larvae. Note the varicosities (arrows) from CSF-cNs onto CoPA soma (A1 and A2), initial segment (A2 and A3), and sometimes dendrites (A3 and A4). Scale bars, 10 μm.
(B) Current-clamp recording of a typical CoPA interneuron showing sparse action potential firing in response to current injections (steps are 20 pA from −50 pA to +150 pA).
(C) Voltage-clamp recording from a CoPA interneuron (Vm = −65 mV) showing an evoked IPSC following a 5-ms light pulse (black trace; average of ten trials).
(D–G) Distribution of IPSC delay (D; mean 7.73 ± 0.15 ms), 20%–80% rise time (E; mean 0.88 ± 0.08 ms), amplitude (F; mean 146.83 ± 16.75 pA, corresponding to a conductance of 10.49 nS), and time decay τ (G; mean 18.16 ± 1.22 ms) (n = 8 cells, 64 trials).
(H) Cumulative probability plot of IPSC amplitudes for CaP motor neurons (blue; n = 271) and CoPA interneurons (red; n = 64).
See also Table S1.